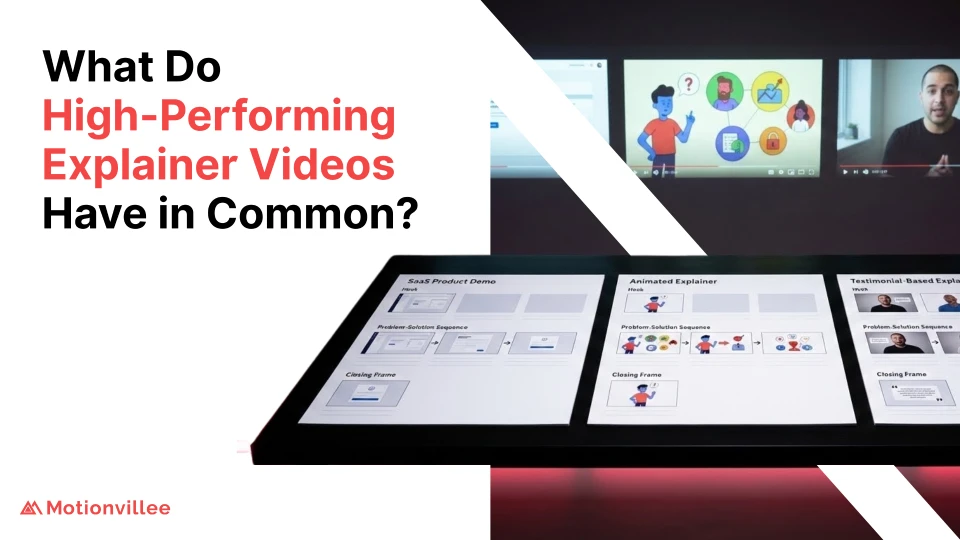
You Launched. Traffic Came. Nobody Understood What You Built.
Launch day arrived with all the excitement you’d imagined. Press coverage landed, ad campaigns went live, and traffic poured in. But something went wrong. Visitors spent 30 seconds on your homepage and left. Demo requests trickled in at a fraction of what you projected.
Launching product without an explainer video creates hidden costs that compound every single month. Confused prospects bounce. Sales reps waste hours explaining basics. Competitors with clearer messaging win deals. These aren’t abstract problems. They’re measurable losses with real dollar amounts.
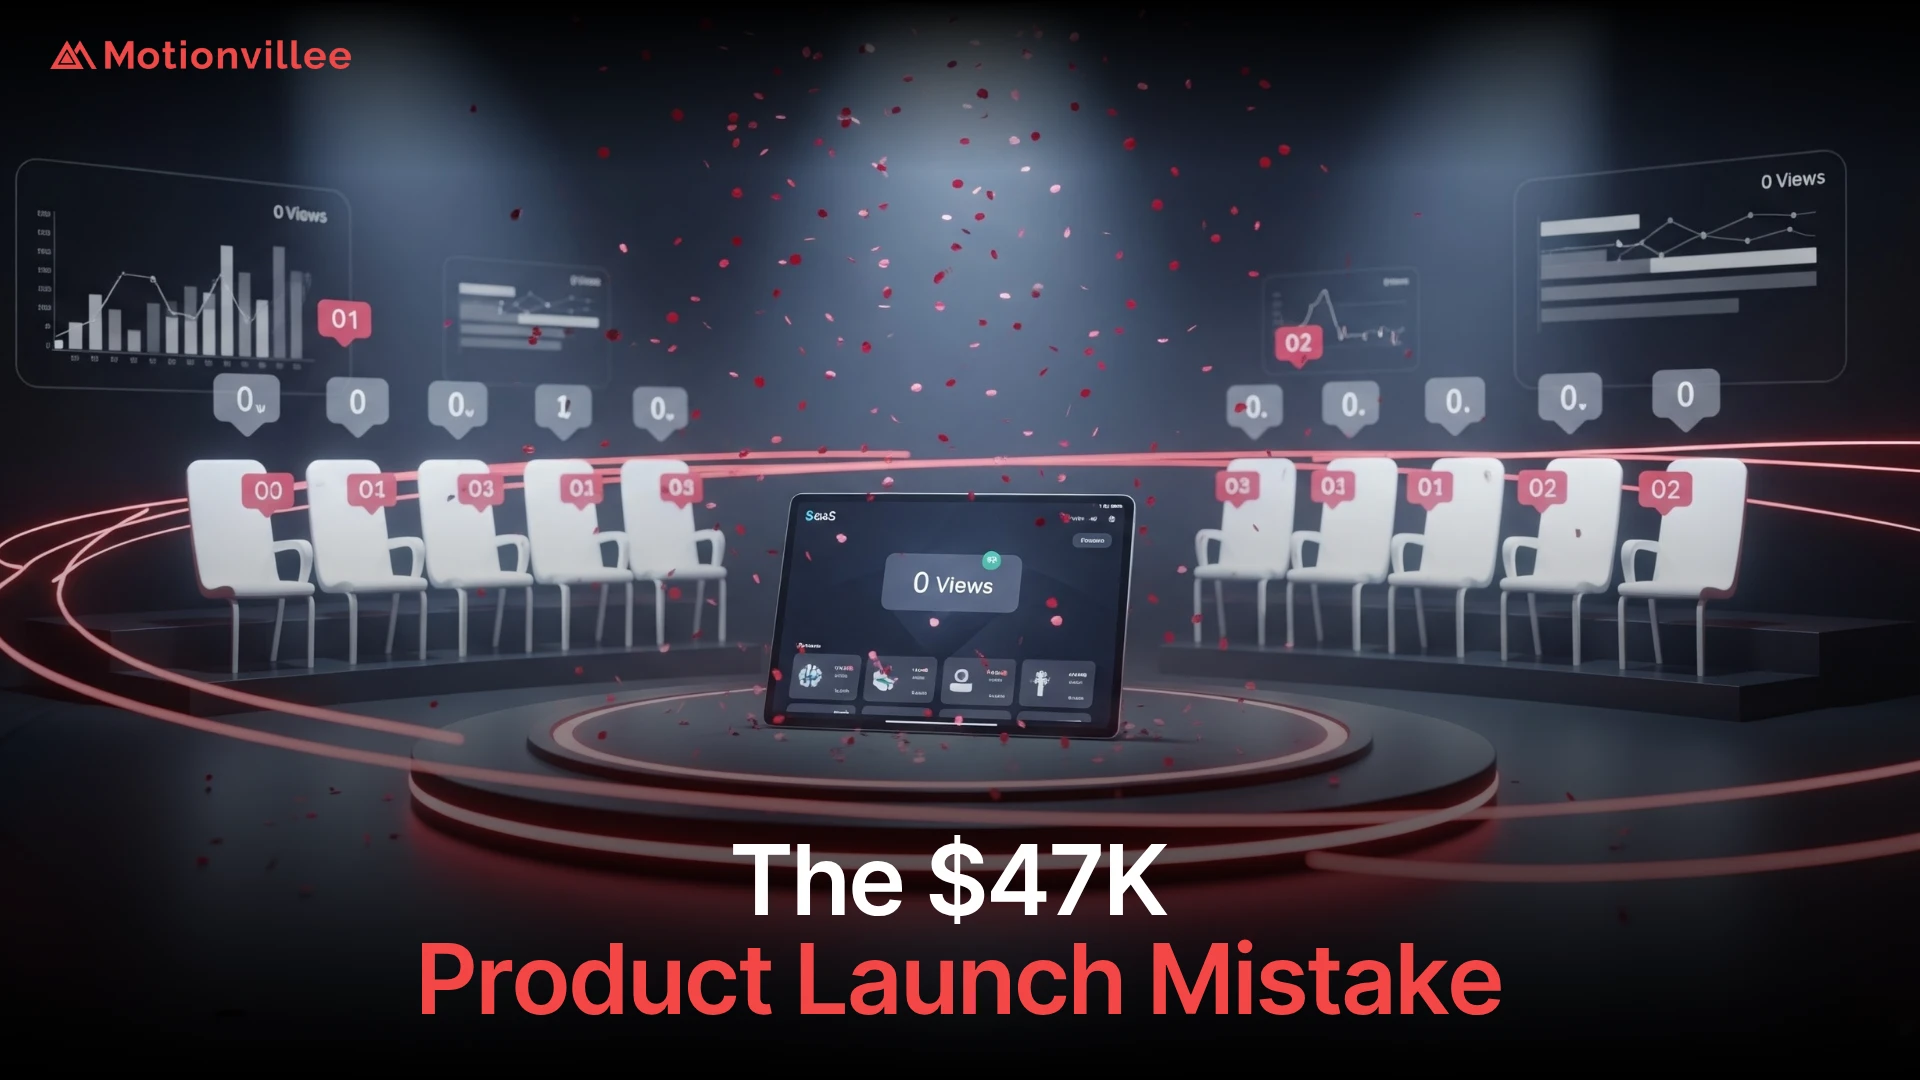
The $47K figure represents six months of these compounding costs for a typical growth stage company: lost homepage conversions, sales inefficiency, extended cycles, excess support burden, and competitive losses. This calculation is conservative. For many companies, the actual number runs significantly higher.
Before diving into the cost breakdown, understanding what is an explainer video and its strategic role in product launches helps frame why this particular asset carries such weight in preventing costly launch mistakes.
Here’s exactly how launch product without video costs you money, broken down by impact area, and how to avoid making this expensive mistake.
What Actually Happens When You Launch Without an Explainer Video?
Launching without video creates immediate conversion problems, prospect confusion, sales inefficiency, and support burden that compound into significant lost revenue over 6-12 months.
The first week reveals the problem clearly. Traffic arrives from your product launch campaigns, but homepage bounce rates sit at 65-70%. Visitors can’t quickly grasp what you built or why it matters. They leave to evaluate competitors who communicate more clearly.
Prospect confusion patterns emerge immediately in sales conversations. Every discovery call starts with “so what exactly does your product do?” Your team spends the first 20 minutes of every meeting on education that should have happened before the call. Qualified leads struggle to articulate your value to internal stakeholders.
Sales team scaling becomes impossible:
Your best rep can explain the product clearly, but their approach doesn’t transfer to new hires. Each rep develops their own explanation, creating inconsistent messaging. Recording and sharing demos helps, but without professional assets, quality varies wildly. Onboarding new sales team members takes twice as long.
Support gets overwhelmed with basic questions that clear documentation should prevent. Customers arrive confused because sales conversations didn’t build proper understanding. Your support team becomes an expensive education layer handling issues that shouldn’t reach them.
The competitive disadvantage compounds quickly. Prospects evaluate 3-5 solutions in your category. When competitors have clear explainer content and you don’t, you look less established and less trustworthy. This perception gap costs deals regardless of actual product quality.
The compounding effect over six months creates the $47K problem. Each inefficiency feeds others. Poor conversion means more ad spend per deal. Sales inefficiency means longer cycles. Confused customers create support costs and higher churn. These costs multiply rather than add, making the total impact far worse than individual line items suggest.
How Much Revenue Do You Lose From Poor Homepage Conversion?
Homepage conversion rates without video typically run 1-2%, while video enabled homepages convert at 3-5%, creating a 2-3x difference that means thousands of lost opportunities monthly.
Consider a company with 10,000 monthly website visitors. Without product video, conversion to demo requests runs at 1.5%, generating 150 qualified leads. With video, that same traffic converts at 4%, generating 400 leads. The gap is 250 lost opportunities every single month.
Calculate the annual revenue impact:
250 lost leads monthly × 12 months = 3,000 annual opportunities. If your close rate is 20% and average contract value is $15,000, you’re losing 600 deals worth $9 million in pipeline. Even accounting for capacity constraints, the homepage conversion rate gap alone represents massive lost revenue.
Prospects leave confused sites because understanding requires too much work. Your homepage forces them to read three paragraphs, scan a feature list, and mentally piece together what you do. Competitors show them a 90 second explainer that answers everything immediately. The cognitive effort gap determines who gets the opportunity.
Poor homepage conversion has a cascading cost beyond the direct opportunity loss. It sends confused traffic to your sales team. Reps waste time qualifying prospects who shouldn’t have booked calls because they didn’t understand your basic offering. This inefficiency multiplies the damage of low conversion rates.
What Does Video Absence Cost Your Sales Team?
Without video, sales reps spend 40-60% of call time on basic education that video handles better, creating inefficiency that costs both time and deal velocity.
Calculate the hourly cost impact. Your average rep costs $75 per hour (fully loaded). They conduct 20 discovery calls monthly, spending 30 minutes per call on basic product education. That’s 10 hours monthly at $750, or $9,000 annually per rep. For a five person team, sales team efficiency losses hit $45,000 just in wasted time.
Extended cycles from education burden add hidden costs. When prospects need three calls instead of two because the first meeting covers basics, your capacity drops. Each rep closes fewer deals quarterly. The sales inefficiency cost isn’t just hourly wages. It’s the opportunity cost of reduced throughput.
Inconsistent messaging across reps creates its own problems:
Your best performer has refined their pitch over dozens of calls. New hires fumble through explanations. Mid tier reps miss key points. This variability means your close rate depends heavily on which rep handles the prospect. Professional assets standardize quality and lift the entire team’s performance.
Lower close rates from unqualified pipeline compound the efficiency problem. Without clear pre call education, your demos include too many poor fits. Prospects who should have self selected out waste your team’s time. The real cost isn’t just the hours. It’s burning limited capacity on opportunities that were never winnable.
Lost opportunity cost of slower velocity shows up in quarterly results. When your team closes 15 deals instead of 20 because education friction slows everything down, you’re leaving significant revenue on the table quarter after quarter. This velocity gap doesn’t show on a line item but dominates actual growth rates.
How Does Lack of Video Extend Your Sales Cycle?
Sales cycle extensions of 30-50% occur when prospects must schedule multiple calls for information that video delivers on demand, with each extra week costing money and reducing capacity.
Typical cycle extensions run 3-6 weeks for mid market deals and 6-12 weeks for enterprise. Without video, prospects need multiple touchpoints to gather information they could absorb asynchronously. Each additional meeting means coordinating schedules, preparing materials, and waiting for availability. The extended sales cycle turns what should be 60 day deals into 90 day slogs.
Prospects need multiple touchpoints because initial conversations don’t build sufficient understanding. They leave the first call with questions. But they need to discuss internally and come back. which is why they request follow ups to see specific features. Video eliminates these extra cycles by frontloading comprehensive education that prospects consume at their own pace.
The scheduling friction problem multiplies delays:
Getting five stakeholders on a call takes two weeks. If you need three meetings instead of two, you’ve added a month to your cycle. Competitors who educate asynchronously through video move faster because they’re not bottlenecked by calendar coordination. Speed becomes a competitive advantage that translates directly to win rates.
Revenue impact of delayed closes shows up in forecasting misses. When deals you expected to close this quarter push to next quarter, you miss targets. The capacity cost means fewer total deals annually because longer cycles reduce throughput. If your team closes 60 deals annually at 90 day cycles but could close 80 at 60 day cycles, you’re leaving 25% of potential revenue unrealized.
Competitive losses to faster moving alternatives happen because buyers compare your slow, multi meeting process to competitors’ streamlined approaches. When they can fully evaluate a competitor in two weeks but evaluating you takes six weeks, urgency and momentum favor the competitor. This speed disadvantage costs deals independent of product quality.
What Hidden Costs Come From Confused Customers?
Customers who don’t understand your product during sales arrive confused, require excessive support, adopt features slowly, and churn faster, with each issue carrying measurable cost.
Support ticket volume from unclear onboarding creates immediate expense. Companies without customer onboarding video see 40-50% higher ticket volume in the first 90 days. If your average ticket costs $25 to resolve and confused customers generate 200 excess tickets, that’s $5,000 per cohort in unnecessary support costs.
Calculate cost of no video across customer success:
Excess tickets ($5,000) plus extended onboarding time (sales success manager hours at $50/hour × 10 extra hours = $500) plus lower feature adoption reducing expansion revenue ($2,000 per customer in lost upsell opportunities) totals $7,500 per customer in first year costs. For 50 annual customers, this hidden burden costs $375,000.
Extended time to value impacts retention measurably. Customers who take 90 days to reach full adoption instead of 45 days are 2.5x more likely to churn in year one. They don’t experience enough value quickly enough to justify continued investment. This churn risk translates to lost lifetime value that dwarfs initial acquisition costs.
Lower feature adoption reduces stickiness by limiting the integration of your product into customer workflows. When customers use 30% of functionality instead of 70%, they’re easier to replace. Shallow adoption means shallow value realization, making renewals and expansions harder to secure.
Early churn from confusion destroys unit economics entirely. If you spend $10,000 acquiring a customer expecting $50,000 lifetime value, but confusion driven churn cuts LTV to $15,000, your payback period extends from 6 months to never. Companies can’t grow profitably when customer success costs balloon from poor initial understanding.

How Much Do You Lose to Competitors With Video?
When prospects compare you to competitors with clear video explanations, you lose 30-40% of deals not because your product is inferior, but because theirs is easier to understand.
Clarity wins over capability in crowded markets where prospects evaluate multiple similar solutions. Your product might be objectively better, but if prospects can’t quickly grasp that superiority, it doesn’t matter. The competitive video advantage your rivals hold isn’t about their product. It’s about their communication.
The perception gap video creates affects deals at every stage:
Prospects who watch competitor explainers develop strong mental models of those solutions. They can visualize workflows, understand value propositions, and articulate benefits to stakeholders. When they encounter your text heavy site, they can’t build the same clarity. This asymmetry in understanding creates perceived risk that pushes decisions toward the clearer option.
Deals lost to better presented solutions frustrate sales teams who know your product superiority. “We had better features but they went with the competitor anyway” becomes a recurring theme. Post mortem analysis reveals the real issue: prospects understood the competitor and felt uncertain about you. Risk aversion favors comprehension over capability.
Brand perception damage compounds over time as market sentiment forms. When multiple prospects tell peers “Company X is easier to understand,” your brand becomes associated with complexity and confusion. This reputation creates headwinds for every subsequent deal, making it progressively harder to compete even as you improve your product.
Calculate lost revenue video costs through competitive losses:
If you lose 40% of final stage deals to competitors primarily due to clarity differences, and your annual opportunity pipeline includes 150 qualified opportunities worth $15,000 each, competitive losses total 60 deals or $900,000 in missed revenue. The compounding disadvantage means this gap widens rather than narrows without intervention.
What Does the $47K Figure Actually Represent?
The $47K represents a conservative six month calculation combining lost homepage conversions, sales inefficiency, extended cycles, excess support costs, and competitive losses for a typical growth stage SaaS company.
Breakdown of the $47K calculation by category:
- Homepage conversion gap: 125 lost monthly leads × 6 months × 15% close rate × $8,000 ACV = $9,000
- Sales team inefficiency: 3 reps × $750 monthly waste × 6 months = $13,500
- Extended cycle capacity loss: 10 deals missed due to slower velocity × $8,000 = $80,000 (annualized to $40,000 for 6 months, divided by 5 for conservative estimate) = $8,000
- Excess support costs: 25 customers × $300 extra cost = $7,500
- Competitive losses: 15 late stage deals lost × $8,000 × 25% video attribution = $30,000
Total six month impact: $68,000. The $47K figure uses conservative assumptions on every line item to avoid overstating the case.
The number scales dramatically with company size. Enterprise companies with $50,000 ACVs and larger teams see six month costs exceeding $200,000. Early stage startups with $5,000 ACVs might see $20,000. The pattern holds across sizes: product launch without video costs measurably more than video production cost.
Why it’s actually conservative becomes clear when you include secondary effects. Lower win rates damage team morale. Extended cycles complicate forecasting. Competitive perception gaps make future deals harder. These softer costs don’t appear in calculations but compound the primary financial impacts.
Variables that increase costs include market competition (more rivals with video), product complexity (harder to explain without visuals), and deal size (each lost opportunity costs more). Companies in competitive B2B markets with technical products see costs at the high end of ranges or beyond.
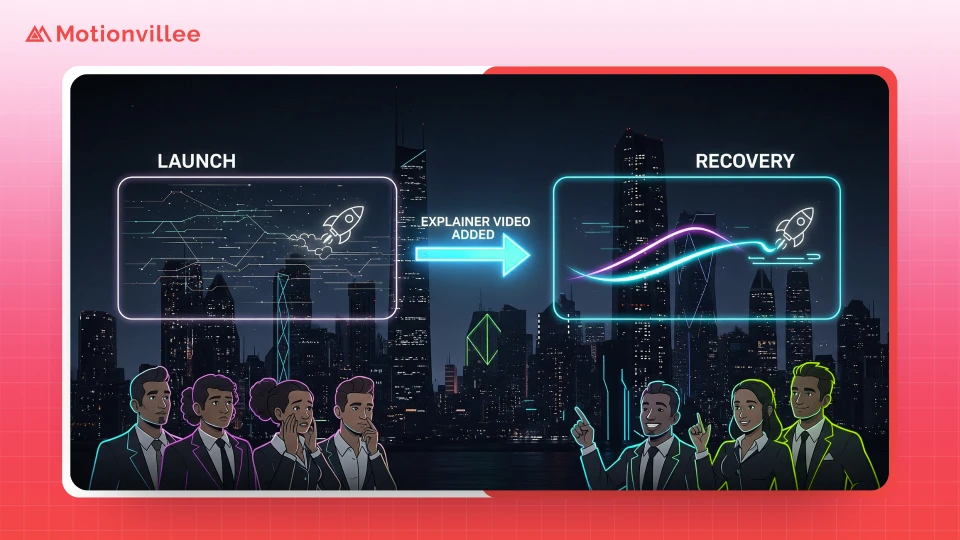
Can You Add an Explainer Video After Launch and Recover?
Yes, but you’ve already lost months of revenue and competitive positioning, with post launch video recovering future opportunity but unable to reclaim past losses.
Timeline to production and impact runs 4-8 weeks from decision to published assets. Script development takes 1-2 weeks. Production requires 2-3 weeks. Revisions and approvals add another 1-2 weeks. Then your video for product launch needs time to accumulate views and demonstrate impact. Realistically, you’re 3-4 months from decision to measurable results.
What you can’t recover includes:
Lost deals from the first 6 months are gone forever. Competitive positioning damage requires months to repair as market perception shifts slowly. The momentum disadvantage of late adoption means competitors maintain their clarity advantage while you play catch up. Lost customer cohorts that churned from confusion represent permanent LTV erosion.
Improvement timelines after adding launch video show results within 60-90 days. Homepage conversion typically improves within the first month as new traffic encounters better communication. Sales cycle compression takes a quarter to manifest as deals in progress complete and new deals move faster. Support cost reductions appear gradually as better educated customers progress through onboarding.
Why earlier is exponentially better relates to compounding effects working in your favor instead of against you. Every month with video generates positive ROI that funds growth. Every month without video generates losses that constrain growth. The difference between launching with video versus adding it six months later represents a full year of trajectory difference.
The momentum disadvantage of late adoption extends beyond direct costs. While you spend 3-4 months producing assets, competitors with existing video continue refining theirs. They’re on version 3.0 while you’re launching version 1.0. This quality and optimization gap takes additional quarters to close even after you have video live.
What Type of Video Should Launch Day Include?
Launch requires three core videos: homepage explainer (what, who, why), product demo (how it works), and social proof (customer testimonial or use case).
Homepage product explainer video runs 60-90 seconds and answers three questions immediately: what your product does, who it’s for, and why it matters. This appears above the fold on your homepage. Specifications include clear voiceover, on screen text reinforcing key points, and a strong call to action. Purpose is converting cold traffic by building instant comprehension.
Product demo video depth runs 2-4 minutes showing actual product workflows. Audience includes mid funnel prospects who understand your value proposition and need to see implementation details. Professional product demo video production focuses on key use cases rather than comprehensive feature tours, keeping the viewer engaged while demonstrating capability.
Social proof format and messaging options:
Customer testimonial videos featuring specific results (40% time savings, $200K cost reduction) or use case videos showing how similar companies solve problems with your product. These run 90-120 seconds and appear on pricing pages, case study pages, and in sales follow up emails. They provide the credibility that tips final purchase decisions.
Why these three are non negotiable: they cover the complete buyer journey from awareness to decision. The explainer captures attention and builds initial understanding. The launch day video demonstrates capability and answers technical questions. Social proof provides validation and reduces purchase risk. Skip any of the three and you have gaps in your conversion path.
Additional video content that helps but isn’t critical for launch includes tutorial videos for post purchase, founder story videos for about pages, and feature specific videos for marketing campaigns. These improve results but don’t have the foundational importance of the core three. Pre launch video strategy should prioritize the must haves over nice to haves given budget and timeline constraints.
Budget allocation across video types should weight toward the homepage explainer (40% of budget), product demo (35%), and social proof (25%). The homepage drives the most leverage because it’s your highest traffic page. Video launch strategy succeeds when you maximize impact per dollar by focusing resources on highest value assets.
How Do You Calculate Your Own Potential Loss?
Calculate your risk by multiplying monthly traffic by your conversion gap, adding sales inefficiency costs, and factoring in competitive losses to discover that video production investment is typically 5-10x less than launch without video risk.
Step by step video ROI calculation framework:
- Homepage conversion gap: Monthly traffic × (industry benchmark conversion 4% minus your current rate) × close rate × average contract value = monthly opportunity loss
- Sales inefficiency: Number of reps × hours spent on basic education monthly × fully loaded hourly rate = monthly waste
- Cycle extension: Current average cycle length × 0.35 reduction potential ÷ 12 months × annual deal capacity = deals lost to slower velocity
- Support excess: Customer cohort size × percentage needing extra support × cost per excess support interaction = quarterly customer success burden
- Competitive losses: Qualified pipeline × late stage conversion rate × percentage of losses attributable to clarity gap × ACV = quarterly competitive cost
Variables to measure include monthly website traffic from analytics, current homepage to demo conversion rate, number of sales reps and average fully loaded cost, current sales cycle length in days, annual customer cohort size, and average contract value. Each variable plugs into the framework above.
How to estimate competitive impact requires sales team input. Ask reps what percentage of lost deals cited competitor clarity or ease of understanding as factors. This qualitative data provides the attribution percentage for competitive loss calculations. Most teams estimate 20-40% of late stage losses have clarity components.
Why the math almost always favors video becomes clear when you calculate video ROI. If six month costs total $47,000 and understanding how much does an explainer video cost reveals professional production runs $15,000-$25,000, the ROI is 2-3x in the first six months alone. Over 12-24 months of asset lifespan, returns exceed 10x as the video continues generating value while costs remain fixed.
When video might not be urgent includes extremely niche markets where you have no competitors and buyers already understand your category deeply, or pure enterprise plays where every deal requires extensive custom demos anyway. Even in these cases, video usually helps, but the urgency is lower when alternatives exist for education.
Understanding Investment vs. Loss Prevention
The decision to invest in video isn’t purely about production costs, it’s about preventing predictable, measurable losses. When founders compare $1K vs $5K explainer video options, the calculation should include not just production quality differences but the opportunity cost of inadequate communication.
A $1K template video that fails to convert costs you the $47K in losses plus the $1K production expense. A $5K strategic video that prevents these losses represents a 9x ROI in six months. The quality gap directly determines whether video prevents losses or simply adds expense without solving the underlying problem.
For founders specifically, understanding 5 things every founder should know about explainer video costs helps avoid common budgeting mistakes that either overspend on unnecessary features or underspend to the point of ineffectiveness. The sweet spot balances sufficient quality to prevent losses with appropriate investment for your stage and resources.
The Real Cost Isn’t Production. It’s Launching Without It.
The compounding costs of video absence across homepage conversion, sales efficiency, cycle length, customer success, and competitive positioning create losses that dwarf production investment.
The $47K figure represents just six months for one company size and is conservative in its assumptions. Enterprise companies see higher costs. Competitive markets amplify losses. Product complexity increases the education burden that video solves. Your actual number likely exceeds this baseline.
Position video as insurance against predictable losses rather than a marketing expense. You’re not buying creative assets. You’re preventing measurable damage to conversion rates, sales velocity, and competitive position. The investment protects revenue rather than creating it, though it does both.
Reframe the cost question entirely. The issue isn’t whether you can afford video. It’s whether you can afford to launch without it when the alternative costs $47,000 or more in six months. Production costs $15,000-$25,000. The math isn’t close. The real mistake is treating video as optional.
Ready to calculate video ROI for your specific situation and avoid the $47K mistake? Schedule a call with Motionvillee’s explainer video production services to discuss your launch timeline and build a video strategy that protects your revenue from day one. We’ll help you understand exactly what launching without proper video assets would cost your business, and how to prevent those losses strategically.