Your CFO Doesn’t Care About Creativity. They Care About Numbers.
Getting CFO video budget approval feels impossible when you lead with creative vision. Finance leaders don’t evaluate video projects on artistic merit. They evaluate them on expected returns, risk mitigation, and competitive necessity.
The challenge isn’t that video lacks value. It’s that marketers present the wrong evidence. CFOs need specific metrics: percentage improvements in conversion, dollar reductions in acquisition cost, and time savings in sales cycles. Without these numbers, your proposal goes nowhere.
This guide provides 13 data points that justify video investment using the language CFOs speak. Each metric includes calculation frameworks, conservative benchmarks, and clear connections to revenue impact. Present these numbers and your CFO video budget approval becomes straightforward rather than contentious.
What ROI Metrics Do CFOs Require for Video Budget Approval?
CFOs need expected return calculations including customer acquisition cost reduction, conversion rate improvements, and sales cycle compression with specific percentage improvements and dollar amounts.
Start with the video production budget request amount and show how it generates returns within 6-12 months. Your proposal should include baseline metrics (current CAC, conversion rates, cycle length) and projected improvements with industry benchmark support. Conservative estimates build credibility where aggressive projections create skepticism.
Essential video ROI metrics for your proposal:
- Customer acquisition cost reduction percentage and dollar amount
- Conversion rate improvements at each funnel stage
- Sales cycle compression in days or weeks
- Support cost reduction from better customer education
- Sales team efficiency gains in hours saved
Calculate payback period by dividing investment by monthly benefit. If video costs $25,000 and generates $5,000 monthly in combined benefits, your five month payback period makes approval straightforward. Include year two and three projections where the investment becomes pure profit since production costs don’t recur.
Link each metric to existing company goals. If your CFO prioritizes CAC reduction, lead with that metric. If sales capacity is constrained, emphasize cycle compression. Align your video business case with what finance already cares about rather than asking them to care about new metrics.
How Do You Calculate Video’s Impact on Customer Acquisition Cost?
Video reduces customer acquisition cost by 15-35% through improved conversion rates at each funnel stage, with calculation showing before and after CAC using traffic, conversion, and cost data.
Start with current CAC calculation: total marketing and sales cost divided by customers acquired. For example, if you spend $100,000 monthly acquiring 50 customers, your CAC is $2,000.
Document this baseline clearly because CFOs will verify your math.
Before and after CAC calculation framework:
- Current state: 10,000 monthly visitors × 2% conversion = 200 leads × 25% close rate = 50 customers. Total cost $100,000 ÷ 50 = $2,000 CAC.
- With video: 10,000 visitors × 4% conversion = 400 leads × 25% close rate = 100 customers. Same $100,000 cost ÷ 100 = $1,000 CAC.
The 50% CAC reduction comes entirely from conversion improvement. Video marketing ROI appears in the efficiency gain where the same marketing spend generates twice the output. This doubles your growth rate without increasing budget, which is exactly what CFOs want to see.
Show the annual impact to make the case compelling. If video reduces CAC from $2,000 to $1,000 and you acquire 600 customers annually, that’s $600,000 in savings or the ability to acquire 1,200 customers with the same budget. Either outcome dramatically improves unit economics.
Include competitive CAC benchmarks for your industry. If competitors achieve $1,200 CAC and you’re at $2,000, video becomes a competitive necessity rather than an optional improvement. Frame it as catching up to industry efficiency standards.

What Conversion Rate Improvements Should You Project?
Homepage videos improve conversion 20-40%, demo videos increase trial signups 30-50%, and email videos boost click through 2-3x using industry benchmarks with conservative estimates.
Use conservative projections to maintain credibility. If industry data shows 40% improvement, project 25% in your proposal. CFOs appreciate conservative estimates that you can exceed rather than aggressive targets you might miss. Actual performance above projections builds trust for future requests.
Video conversion rates by asset type and placement:
- Homepage explainer videos: 20-35% improvement in demo requests
- Product demo videos: 30-50% increase in trial signups
- Email videos: 200-300% higher click through rates
- Landing page videos: 25-40% conversion lift
- Social videos: 150-250% engagement increase versus static posts
Document current conversion rates across these touchpoints before presenting projections. If your homepage converts at 1.5% today, a conservative 25% improvement brings it to 1.9%. Show the math explicitly so CFOs can verify assumptions and adjust variables if they want more conservative numbers.
Explain why video drives conversion improvements through reduced cognitive load, faster comprehension, and increased trust. CFOs understand efficiency gains. Video explains complex products in 90 seconds versus 10 minutes of reading, reducing the effort prospects must invest to understand your value.
Include testing protocols in your proposal. Commit to A/B testing video versus non video pages to measure actual lift. This reduces perceived risk by showing you’ll validate assumptions with data rather than assuming projections will materialize automatically.
How Does Video Compress Sales Cycles?
Video reduces sales cycle length 25-40% by handling prospect education asynchronously, with revenue impact calculated as shorter cycles multiplied by increased capacity equals more closed deals quarterly.
Calculate current cycle length from first contact to closed deal. If your average is 90 days and video compresses it to 60 days through better pre call education, that’s 33% sales cycle reduction. The capacity impact means your team closes four deals per year per account instead of three.
Cycle compression revenue calculation:
- Current state: 90 day cycles × 5 reps = 20 annual deals per rep = 100 total deals.
- With video: 60 day cycles × 5 reps = 30 annual deals per rep = 150 total deals.
At $50,000 average contract value, the 50 additional deals equal $2.5 million in incremental revenue. This B2B video investment return typically exceeds production costs by 10-20x in the first year alone, making the financial case overwhelming.
Show why cycles compress when prospects watch product demos before calls. Sales reps spend 40-60% less time on basic education, moving directly to fit assessment and objection handling. This efficiency lets them manage more opportunities simultaneously without burning out.
Include deal velocity metrics in your tracking plan. Measure time from marketing qualified lead to sales qualified lead, SQL to demo, demo to proposal, and proposal to close. Video should improve multiple stages, not just one. Document where compression happens to optimize video placement.
What Production Cost Breakdown Should You Present?
Itemize video production costs across strategy, production, and distribution including cost per video type, revision allowances, and timeline while comparing one time investment to ongoing asset value.
Break down costs into understandable categories that show where money goes. CFOs distrust vague “video production” line items but appreciate detailed cost structures they can evaluate and negotiate if needed. Transparency builds confidence in your marketing budget justification.
Standard video budget proposal structure:
- Strategy and scripting: 20% of budget (discovery, messaging, script development)
- Production: 60% of budget (filming, animation, voiceover, editing)
- Revisions: 10% of budget (two revision rounds included)
- Project management: 10% of budget (coordination, timeline management)
Include cost per video type with clear deliverable specifications. Homepage explainer at $15,000 includes 90 second duration, professional voiceover, custom animation, and two revision rounds. Product demo at $20,000 includes 3 minute screen recording with annotations, explaining three key workflows.
Compare one time production investment to ongoing value creation. A $25,000 homepage video works 24/7 for 18-24 months, generating thousands of conversions. Cost per conversion drops below $5 within months while paid ads might cost $200 per conversion. The economics strongly favor the one time asset investment.
Show timeline and milestone schedule so CFOs understand production duration and can plan budget timing. Eight week timeline broken into approval gates (script, rough cut, final) gives finance visibility into progress and helps them manage cash flow if that matters for timing.

How Do You Show Video’s Multi-Use Value?
Single video assets serve 5-7 purposes including homepage, sales enablement, paid ads, social, email, onboarding, and support with cost per use calculations showing efficiency.
Calculate cost per use to demonstrate video asset efficiency. A $20,000 product demo used across seven channels costs $2,857 per use, making it more economical than creating seven separate assets. This multi-use value amplifies ROI beyond single channel deployment.
Typical distribution channels per video asset:
- Website homepage or product pages
- Sales team demo presentations and follow up emails
- Paid advertising on LinkedIn, YouTube, and display networks
- Organic social media posts across platforms
- Email marketing campaigns and nurture sequences
- Customer onboarding and training materials
- Support documentation and help center articles
Track performance across each channel to show comprehensive value. Your homepage video might generate 500 monthly conversions while the same asset in sales emails generates 200 more and paid ads add another 300. Total impact of 1,000 monthly conversions from one $20,000 asset equals $20 cost per conversion.
Include asset lifespan projections. Homepage videos remain effective for 18-24 months before requiring updates. Calculate total value over lifespan rather than just launch month. A video generating $10,000 monthly value for 20 months delivers $200,000 total return on a $20,000 investment.
Document how you’ll track usage across channels. CFOs want accountability for claimed benefits. Commit to monthly reporting showing views, conversions, and calculated value by channel to prove the multi-use value you projected.
What Competitor Benchmarking Data Proves Video Necessity?
Show percentage of top competitors using video, their engagement metrics versus yours, and deals lost citing competitor clarity to make video a competitive parity requirement.
Audit your top 10 competitors’ websites, recording which have homepage explainer videos, product demos, and customer testimonials. If 8 of 10 use video extensively and you don’t, you’re creating a competitive disadvantage that costs deals regardless of product superiority. Competitor video analysis reveals market expectations.
Competitive intelligence to include:
- Percentage of competitors with homepage video (typically 70-80% in B2B software)
- Average video view counts on competitor content
- Engagement rates on competitor social video versus your static posts
- Sales team feedback on deals lost citing competitor clarity
Present specific lost deal examples where sales cited competitor video as an advantage. “Prospect watched Competitor X’s demo video and understood their product immediately while we required three calls to explain ours” becomes powerful evidence for CFOs who care about win rates.
Show engagement gaps between competitor video and your static content. If competitor LinkedIn videos average 5,000 views and 200 engagements while your text posts get 500 views and 10 engagements, the performance difference proves market preference for video formats.
Frame video as defensive investment rather than offensive growth play. You’re not trying to get ahead of competitors. You’re catching up to table stakes expectations in your market. This risk mitigation angle resonates with CFO mindsets about protecting market position.
How Do You Quantify Support Cost Reduction From Video?
Customer education videos reduce support tickets 30-40% with calculation of ticket reduction multiplied by cost per ticket multiplied by customer cohort size equals quarterly savings.
Calculate current support costs per customer cohort. If your average support ticket costs $25 to resolve (agent time plus system costs) and new customers generate 400 tickets in their first 90 days, that’s $10,000 in support costs per 50 customer cohort.
Support cost reduction calculation:
- Current: 50 customers × 8 tickets each × $25 per ticket = $10,000 quarterly support cost.
- With video: 50 customers × 5 tickets each × $25 per ticket = $6,250 quarterly support cost.
- Savings: $3,750 per cohort per quarter = $15,000 annually per cohort. At 200 annual customers (four cohorts), video saves $60,000 in support costs annually, often covering production investment entirely through this single benefit.
Document which support categories video addresses. Onboarding questions, feature confusion, and workflow clarification typically represent 60-70% of tickets for new customers. Customer education video that explains these topics proactively prevents the majority of predictable support requests.
Include support team validation of the opportunity. Have your support lead confirm that specific ticket categories could be prevented with better upfront education. Their endorsement strengthens your case and shows cross functional alignment on the solution.
Tie support reduction to customer experience improvements. Customers who don’t need to contact support have better experiences and higher satisfaction scores. The financial benefit combines hard cost savings with soft retention improvements that compound over customer lifetime.

What Sales Team Efficiency Gains Should You Include?
Video saves 40-60% of discovery call time with calculation of hours saved multiplied by rep cost multiplied by number of calls equals monthly efficiency gains exceeding video cost.
Calculate fully loaded sales rep cost including salary, commission, benefits, tools, and management overhead. A rep earning $100,000 with 50% load costs $150,000 annually or $75 per hour. Document this baseline because sales team productivity improvements justify significant investment when you quantify the value.
Sales efficiency calculation framework:
- Current: 20 monthly discovery calls × 60 minutes each × 50% time on basic education = 600 minutes (10 hours) at $75/hour = $750 monthly waste per rep.
- With video: Prospects watch product demo before calls, reducing education time to 20 minutes per call. Savings: 400 minutes (6.7 hours) × $75 = $502 per rep monthly.
For a five person sales team, monthly savings total $2,510 or $30,120 annually. This efficiency gain alone covers a significant B2B video production investment while improving sales capacity and reducing rep burnout from repetitive explanations.
Show capacity impact beyond cost savings. Reps who spend less time educating handle more opportunities simultaneously. If education time drops 40%, each rep can manage 40% more active opportunities, directly increasing closed deals without hiring additional headcount.
Include sales team testimonials about time wasted on basic explanations. Direct quotes from reps describing how much time they spend repeating product overviews build credibility and show ground level support for the video investment.
Track actual time savings post launch to validate projections. Commit to recording call durations before and after video deployment, proving the efficiency gains you promised. This accountability increases CFO confidence in your numbers.
How Do You Project Customer Lifetime Value Improvements?
Better educated customers have 20-30% higher retention and 40% faster feature adoption with LTV increase multiplied by customer volume showing revenue impact.
Calculate current customer lifetime value using retention rate and average revenue per customer over expected lifetime. If customers stay an average of 36 months paying $10,000 annually, base LTV is $30,000. Document this baseline to show improvement clearly.
LTV improvement calculation:
- Current LTV: $10,000 annual value × 3 years average tenure = $30,000.
- Improved LTV: Better onboarding increases tenure to 3.5 years and feature adoption drives 10% expansion revenue. $11,000 annual value × 3.5 years = $38,500.
- Gain per customer: $8,500 × 200 annual customers = $1.7 million incremental lifetime revenue. This LTV expansion often represents the largest single benefit of video investment, dwarfing upfront conversion improvements.
Explain why video improves retention through better initial understanding. Customers who truly grasp your product’s value during sales and onboarding don’t churn from confusion or misaligned expectations. They understood what they bought and how to use it effectively from day one.
Show feature adoption velocity improvements. Customers who watch tutorial videos adopt advanced features 40-50% faster than those relying on written documentation. Faster adoption increases perceived value and stickiness, reducing churn risk and increasing expansion opportunity.
Include conservative estimates given the long term nature of LTV projections. Use the low end of improvement ranges and show sensitivity analysis. If actual improvement is 15% instead of 25%, does the investment still make sense? Usually yes, which gives CFOs confidence in downside scenarios.
Track cohort retention metrics to validate LTV improvements over time. Calculate video returns by comparing retention curves between cohorts onboarded with and without video. This long term tracking proves the sustained value beyond initial conversion gains.
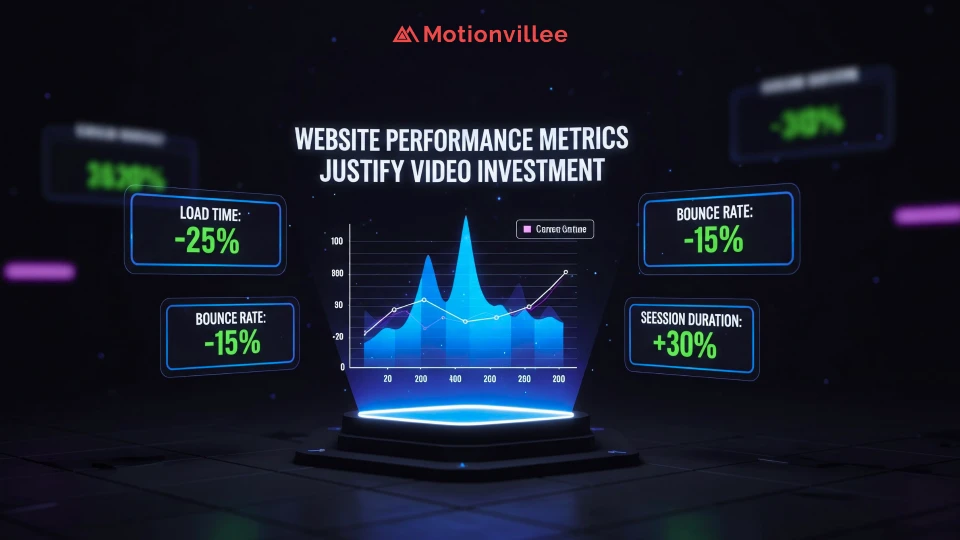
What Website Performance Metrics Justify Video Investment?
Track bounce rate reduction of 20-35%, time on site increase of 50-100%, and pages per session improvement of 30-50% while correlating to pipeline quality.
Present current website performance metrics from analytics as baseline. If homepage bounce rate is 68%, average session duration is 45 seconds, and pages per session is 1.8, these numbers establish the starting point for improvement measurement. CFOs appreciate before and after comparisons with clear methodology.
Website performance metrics to track:
- Bounce rate reduction (percentage of single page visits)
- Average session duration increase (time spent on site)
- Pages per session improvement (depth of engagement)
- Scroll depth on key pages (how much content visitors consume)
- Return visitor rate (indication of content value)
Connect website performance metrics improvements to pipeline quality. Lower bounce rates and longer sessions indicate better prospect understanding, which correlates with higher qualified lead rates. If improving these metrics from bottom quartile to top quartile associates with 30% higher lead quality, the pipeline value becomes measurable.
Show engagement depth as a leading indicator of conversion intent. Prospects who watch your homepage video, visit three additional pages, and spend five minutes on site convert at 3-4x the rate of those who bounce after 20 seconds. Video drives the engagement depth that predicts conversion.
Include competitive performance benchmarks. If industry average bounce rate is 45% and yours is 68%, you’re losing deals to friction that competitors don’t have. Closing the gap to industry norms becomes a competitive necessity beyond pure growth optimization.
Commit to monthly reporting on these metrics with clear attribution to video deployment. Show how homepage video launch correlates with specific metric improvements in the weeks following. This data driven approach gives CFOs confidence you’ll track what you promise.
How Do You Calculate Risk Cost of Not Investing?
Show lost opportunity cost of current poor conversion multiplied by traffic over 12 months versus video improved conversion, with the gap usually exceeding production cost 5-10x.
Calculate the annual cost of maintaining current performance. If your homepage converts at 1.5% and video would improve it to 3.5%, the 2% gap multiplied by monthly traffic and annual volume shows massive lost opportunity. This video investment risk framing shifts the question from “should we spend money?” to “can we afford not to?”
Risk cost calculation framework:
- Current state: 120,000 annual visitors × 1.5% conversion = 1,800 leads × 20% close rate × $15,000 ACV = $5.4 million revenue.
- With video: 120,000 visitors × 3.5% conversion = 4,200 leads × 20% close rate × $15,000 ACV = $12.6 million revenue.
- Lost opportunity: $7.2 million annual revenue gap versus $30,000 video production investment. The risk of not investing costs 240x the investment itself, making the decision mathematically obvious.
Show cumulative cost over multiple years. If you delay video investment for two years while continuing to lose deals to poor conversion, the total lost opportunity exceeds $14 million while video cost remains under $50,000 including updates. The longer you wait, the worse the economics become.
Include competitive loss acceleration. As more competitors adopt video, your clarity disadvantage worsens rather than staying static. The risk cost compounds as market expectations evolve and you fall further behind table stakes communication standards.
Present this as a risk mitigation investment rather than a growth investment. CFOs understand protecting existing opportunity differently than chasing speculative gains. Frame video as preventing predictable losses that you can calculate with confidence.
What Timeline and Milestone Tracking Should You Propose?
Present phased rollout with monthly video performance tracking, A/B testing plans, and adjustment protocols showing how you’ll measure and optimize post launch.
Create a detailed implementation timeline showing production phases, deployment schedule, and measurement periods. CFOs want clear project plans with defined milestones and accountability checkpoints. Vague “we’ll create some videos” proposals fail where structured plans with specific deliverables succeed.
Phased rollout timeline example:
- Month 1: Strategy, scripting, and baseline metric documentation
- Month 2: Production and initial deployment on homepage
- Month 3: A/B testing and performance measurement
- Month 4: Expansion to additional channels based on results
- Months 5-6: Optimization and reporting on full ROI realization
Include A/B testing methodology to reduce perceived risk. Commit to testing video versus non video versions to measure actual lift rather than assuming projections. This scientific approach appeals to financially minded executives who want validated results.
Define success metrics with specific targets. Homepage conversion should improve from 1.5% to 2.5% within 90 days. Sales cycle should compress from 90 to 70 days within one quarter. Clear targets create accountability and give CFOs concrete expectations.
Propose monthly reporting with actual performance versus projections. Show willingness to be held accountable for claimed benefits. Include adjustment protocols if results underperform: what you’ll optimize, how quickly, and what triggers a strategic pivot if needed.
Document how you’ll capture and report ROI across all benefit categories. Create a dashboard tracking conversion rates, sales efficiency, support costs, and engagement metrics in one place. This consolidated reporting makes it easy for CFOs to verify that video delivers promised returns.
CFOs Approve Budgets That Show Clear Returns
The 13 data points above transform video from a creative wish list item into a financially justified investment with measurable returns.
CFOs don’t reject video because they don’t understand its value. They reject vague proposals lacking financial rigor. When you present specific conversion improvements, cost reductions, and revenue impacts with conservative estimates and tracking commitments, the CFO approval process becomes straightforward.
Position video as a measurable investment with defined payback periods and ongoing value creation rather than an expense that disappears after production. The economics favor video overwhelmingly when you quantify efficiency gains, conversion improvements, and competitive risk mitigation.
The data driven approach separates successful budget requests from rejected ones. Lead with numbers, support with methodology, and commit to tracking. This financial discipline proves you understand business impact beyond creative vision.
Ready to build a CFO ready business case for your video investment? Schedule a call with Motionvillee to develop the specific calculations and projections your finance team needs to approve budget confidently. We’ll help you quantify the full ROI across all benefit categories discussed above.


