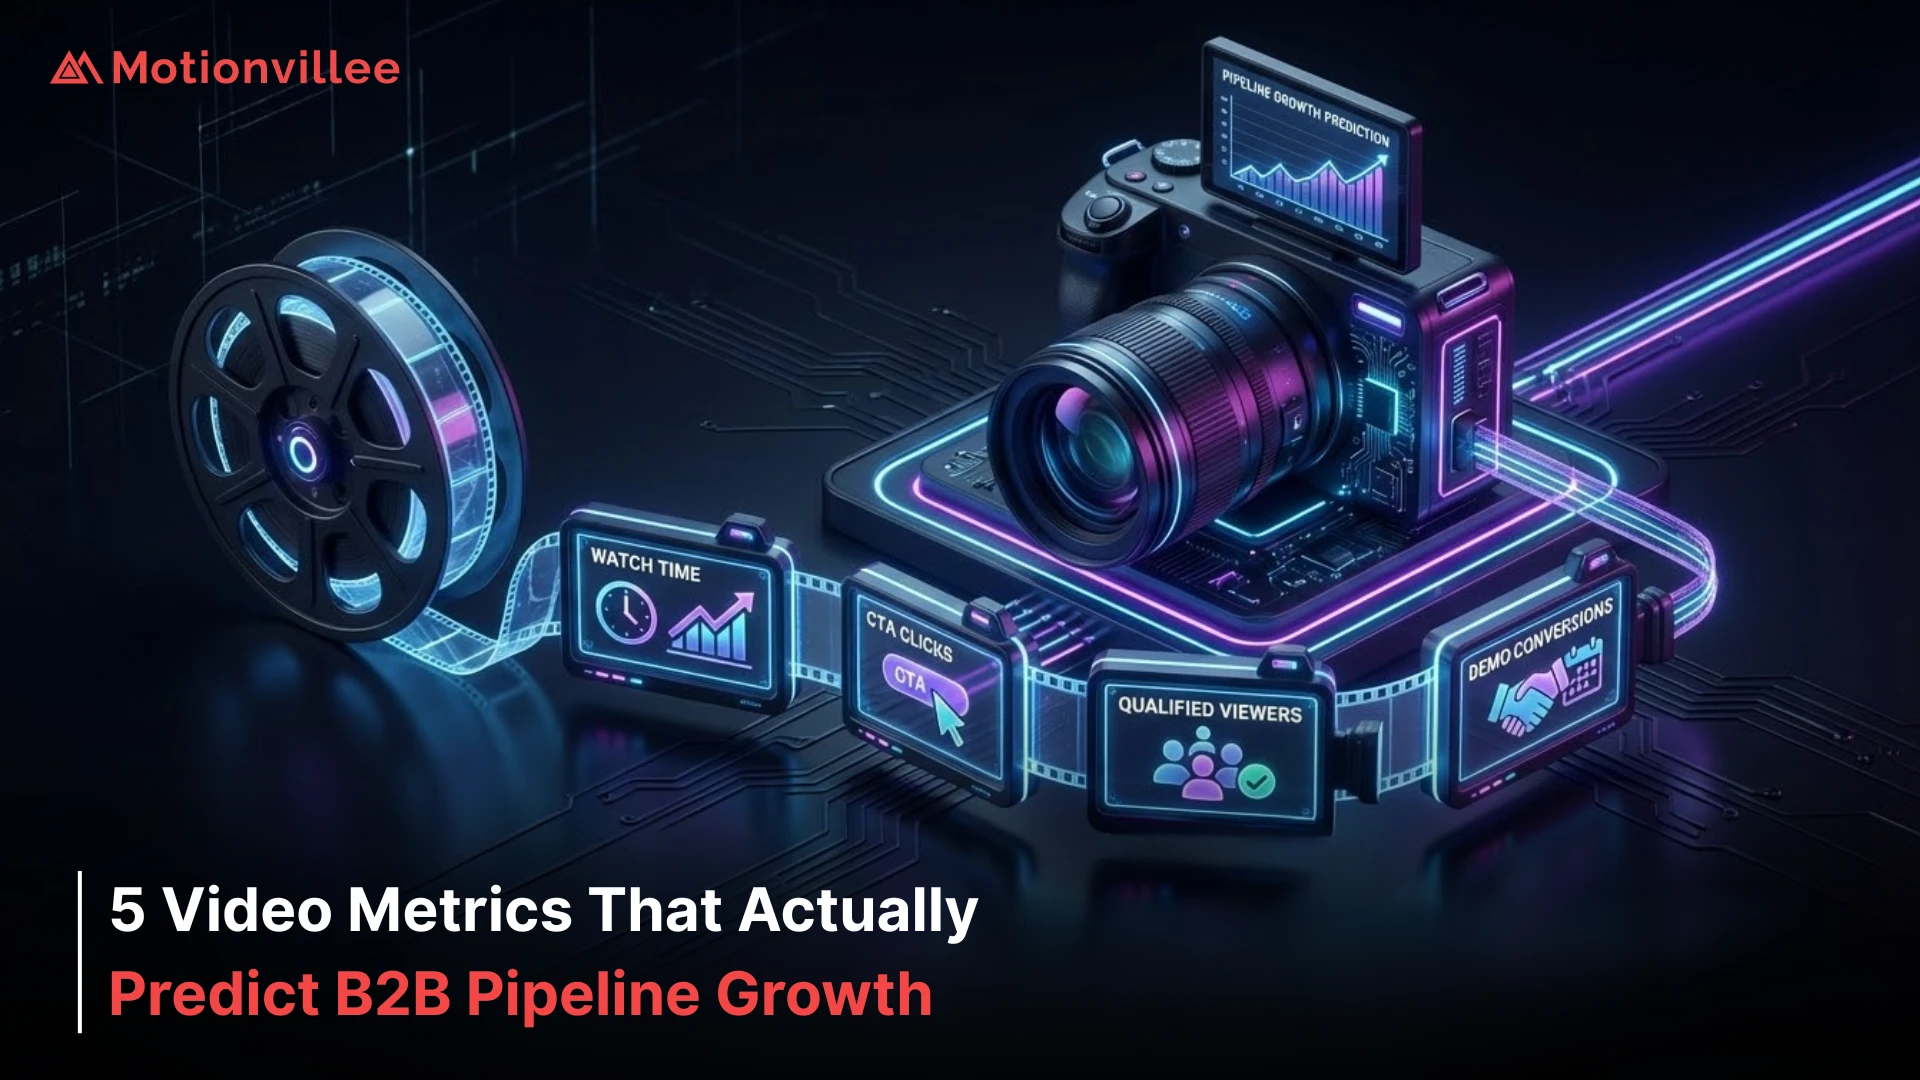
What Are the 5 Video Metrics That Actually Predict B2B Pipeline Growth?
Most B2B companies measure video success by counting views and likes. These vanity metrics feel good but tell you nothing about pipeline impact. The five video metrics pipeline growth actually depends on are different, measurable, and directly connected to revenue.
Why You’re Tracking Wrong Video Metrics and Missing Growth
Most companies track vanity metrics like views and engagement that don’t correlate to pipeline, missing the five metrics that actually predict revenue growth.
A video gets 5,000 views. The team celebrates. But those 5,000 views generated zero demos and zero revenue. Views measure distribution reach, not business impact.
The disconnect exists because vanity metrics are easy to track. View counts live in YouTube analytics. Engagement sits in platform dashboards. But pipeline impact requires connecting video viewing to demo requests to closed deals.
This connection is harder to measure, which is why most companies skip it. They celebrate views instead of measuring what matters: how many prospects booked demos and how many of those became customers.
Using professional video production services USA solves this only if you’re measuring the right metrics. A beautiful video that doesn’t drive pipeline is still a waste. Measurement strategy matters as much as production quality.
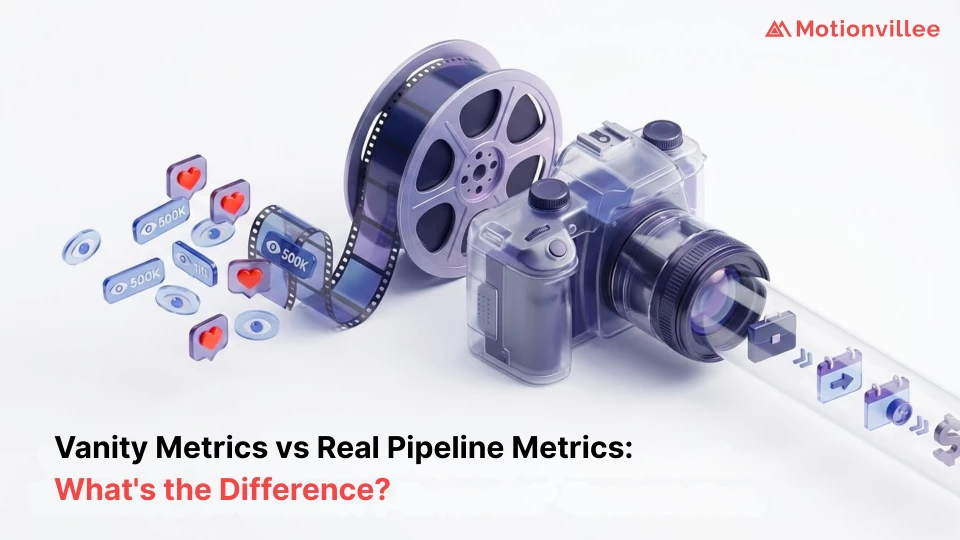
Vanity Metrics vs Real Pipeline Metrics: What’s the Difference?
Vanity metrics measure audience size and attention, while pipeline metrics measure business outcomes like demo bookings, sales speed, and customer cost.
| Metric Type | Vanity Metrics (Misleading) | Pipeline Metrics (Predictive) |
|---|---|---|
| View Count | 5,000 people watched the video (feels good) | Only measure if 60%+ watched to completion |
| Engagement | 200 likes and 50 shares (surface level) | 15 people clicked demo CTA (action taken) |
| Click Rate | 5% clicked “learn more” (low bar) | 20% of viewers booked qualified demos (high intent) |
| Time Spent | Average 2 minutes watched (some attention) | 70% completion rate plus demo booking (positioning worked) |
| Success Definition | Video went viral or trended (visibility) | Video generated $500K in pipeline (revenue impact) |
| Business Insight | No correlation to revenue or growth | Directly predicts pipeline acceleration and ROI |
Pipeline metrics connect to money. Vanity metrics connect to ego. CFOs care about metrics connected to revenue. That’s where your attention should be.
Why Video Completion Rate Predicts Demo Bookings
Completion rate reveals whether your video holds attention and messaging resonates, predicting whether viewers will take action like booking demos.
- What Completion Rate Measures: The percentage of viewers who watch your entire video from start to finish. A 70% completion rate means 7 out of 10 viewers stayed engaged through the end. A 30% completion rate means 7 out of 10 viewers dropped off.
- Why It Predicts Demos: If prospects abandon your video halfway through, they didn’t hear your CTA and didn’t understand your complete positioning. Videos with 70%+ completion drive higher demo bookings because viewers engaged long enough to feel convinced.
- Benchmark Target: Aim for 70%+ completion for awareness videos, 75%+ for consideration videos, and 80%+ for decision videos. If completion is below 50%, your opening hook or pacing is losing viewers.
- What It Reveals About Positioning: If viewers drop off in the first 15 seconds, your opening problem statement isn’t resonating. If they drop off mid-video, your solution explanation is confusing. Completion rate pinpoints where messaging fails.
- Connection to Pipeline: Videos with 70%+ completion have 15%+ demo booking conversion. Videos with 40% completion have 3% demo booking conversion. Completion rate directly predicts whether prospects move to next funnel stage.
The Demo Booking Rate: Your True Conversion Metric
Demo booking conversion directly measures whether video messaging drives buying intent and qualifies prospects, making it the most critical pipeline indicator.
- What Demo Booking Rate Measures: The percentage of video viewers who click your demo CTA and schedule a meeting. If 100 people watch your video and 15 book demos, your demo booking rate is 15%.
- Why It’s Critical: Demos are the conversion event that matters. A demo is a qualified prospect who believes your solution might fit their problem. Views don’t equal interest. Demos equal intent.
- Benchmark Performance: Awareness videos should drive 5-8% demo booking rate. Consideration videos should drive 12-18%. Decision videos should drive 20-35%. If your rates are below benchmarks, positioning strategy needs improvement.
- Calculation Framework: Divide total demo requests by total video viewers. If 1,000 people watched your product demo video and 120 booked demos, your rate is 12%. Track this per video to identify high and low performers.
- Why It Predicts Pipeline: Higher demo booking rates mean better qualified prospects entering your funnel. Lower booking rates mean poor positioning or weak CTAs. This metric directly impacts pipeline volume and quality.
How Faster Sales Cycles Prove Your Video Works
Sales cycle acceleration measures how much faster prospects move through the funnel after watching video, proving that positioning creates buyer confidence and urgency.
Sales Cycle Measurement
Compare the average sales cycle for prospects who watched your video versus those who didn’t. If video watchers close in 45 days and non-watchers close in 65 days, video accelerated the cycle by 20 days (30% faster).
Why Video Accelerates Sales Cycles
Strategic video positions your solution before sales conversations start. Prospects arrive at first sales meeting already understanding the problem and your approach. They ask product questions instead of foundational questions. This accelerates progression.
Pipeline Impact of Acceleration
A 30% faster cycle means you close more deals per quarter without increasing marketing volume. If you normally close 10 deals per quarter, a 30% acceleration could mean 13 deals from the same prospect pool.
Measurement Method
Tag prospects in your CRM by which videos they watched. Track their deal progression through the funnel. Calculate average days from first touch to closed deal by video watched versus no video. This reveals true cycle acceleration.
Connection to B2B Marketing Videos
B2B marketing videos designed with strategic positioning consistently accelerate sales cycles by 25-40%. This isn’t vanity. It’s measurable revenue impact.
Lead Quality Over Lead Quantity: Why It Matters
Lead quality measures whether video-sourced prospects have genuine buying intent and fit your ideal customer profile, distinguishing real opportunities from tire-kickers.
You can generate 100 demos that convert to zero customers or 20 demos that convert to six customers. The second scenario is dramatically better despite lower volume.
Lead quality combines fit (does the prospect match your ideal customer profile) and intent (do they genuinely want to solve this problem). Videos with strong positioning attract higher quality leads because they self-qualify prospects.
A prospect who watches a problem-focused, solution-positioning video has already decided they want to solve the problem. They’re more likely to become customers. A prospect who watches a generic feature overview might book a demo out of curiosity but has low buying intent.
Measure quality by tracking demo-to-customer conversion rate by video. If one video drives 20 demos that convert 40% (8 customers) and another drives 40 demos that convert 10% (4 customers), the first video generates higher quality leads.

How to Calculate Your Real Video ROI
Customer acquisition cost per video calculates true production efficiency by accounting for cost, demo conversion, and sales cycle, revealing actual profitability.
- Formula Step 1: Total Video Investment. Add production cost, platform costs, distribution budget, and founder time value. If a video costs $10,000 to produce, add distribution spend and time. Total investment might be $15,000.
- Formula Step 2: Demos Generated. Track how many qualified demos the video generated over 12 months. If the video generated 50 qualified demos, divide $15,000 by 50. Cost per demo is $300.
- Formula Step 3: Demo-to-Customer Conversion. Calculate what percentage of demos converted to customers. If 50 demos generated 15 customers, your conversion rate is 30%. Divide $300 by 30% to get cost per customer: $1,000.
- Formula Step 4: Compare to CAC. Compare $1,000 video CAC to your average CAC from all channels. If your company average is $2,500, video is 60% more efficient. If video CAC is $5,000, you need to improve positioning.
- Formula Step 5: Calculate ROI. If $1,000 CAC converts to customers worth $50K lifetime value, your ROI is 4,900%. This shows whether video investment is profitable.
Setting Up Video Tracking That Actually Works
Integrate analytics connecting video views to demos to closed deals, creating attribution that proves video pipeline impact and guides 2026 strategy.
| Tracking Step | Common Mistake | Best Practice |
|---|---|---|
| Video Hosting Platform | Use YouTube for everything, no custom tracking | Use Vidyard or similar to add custom tracking codes |
| CRM Integration | Video views don’t sync to CRM | Every video view logs to prospect record in CRM |
| Demo Attribution | No connection between video watched and demo booked | Track which video each demo requester watched |
| Deal Attribution | No way to see video correlation to closed deals | Report shows revenue generated by video source |
| Data Analysis | Manual spreadsheets, inconsistent data | Automated dashboards showing completion, conversion, ROI |
| Reporting Cadence | Quarterly or annual reporting (too late to optimize) | Monthly reporting identifying underperformers fast |
Setup process starts with tagging. Every video gets a unique code. When prospects watch, the system records completion, demo booking, and eventually customer status. Your CRM becomes the source of truth for video pipeline impact.
Companies with mature tracking systems know exactly which videos drive revenue. They optimize based on data. Companies without tracking guess. They continue funding underperformers and miss expansion opportunities for high-performers.
At Motionvillee, we help you implement tracking that connects video to pipeline impact. We set up the attribution you need to prove ROI and guide strategic planning. Let’s schedule a consultation to audit your current measurement and show you how to track the metrics that predict pipeline growth.