Explainer Video Budget Planning Guide for SaaS Teams in 2026
SaaS explainer video budget planning requires strategic allocation beyond simple project quotes. Your video investment must accommodate product updates, multiple buyer personas, and continuous feature releases that consumer brands never face.
Why SaaS Video Budgets Differ From Other Industries
SaaS video budgets differ from other industries because product-led growth demands continuous content creation, frequent updates for product changes, and videos serving every stage of complex buyer journeys.
Traditional product companies create videos once and use them for years. SaaS teams face different realities:
- Product updates every sprint require video refreshes
- Multiple user personas need tailored explanations
- Free trial conversions depend on onboarding video quality
- Feature releases demand immediate video support
Budget planning must account for ongoing production, not one-time projects:
- Awareness videos for paid acquisition
- Product demos updated quarterly
- Feature tutorials for new releases
- Customer success videos reducing support tickets
Understanding what explainer videos are and how they work helps SaaS teams plan budgets that support product-led growth strategies rather than treating video as isolated marketing projects.
Current Market Rates: What SaaS Companies Actually Spend on Video
SaaS companies spend between $35,000 and $180,000 annually on video content, with investment levels varying dramatically by growth stage and go-to-market strategy.
Industry Benchmarks by Company Stage and Revenue
| Company Stage | Annual Revenue | Typical Annual Video Budget | Video Focus Areas |
|---|---|---|---|
| Pre-Seed/Seed | $0-$1M ARR | $15,000-$35,000 | Core explainer, basic product demo |
| Series A | $1M-$5M ARR | $35,000-$75,000 | Feature videos, customer testimonials, sales enablement |
| Series B | $5M-$20M ARR | $75,000-$150,000 | Full funnel content, localization, vertical-specific demos |
| Growth Stage | $20M+ ARR | $150,000-$300,000+ | Enterprise programs, continuous production, global content |
These benchmarks include production costs plus internal coordination time, but exclude paid distribution budgets.
The Video Investment Sweet Spot for Product-Led Growth
Product-led growth companies achieve optimal ROI when video budgets represent 8-12% of total marketing spend.
Why this range works for PLG strategies:
- Supports self-service trial activation through onboarding videos
- Reduces sales team explanation burden with product demos
- Enables feature adoption through in-app tutorial videos
- Drives organic growth via shareable explainer content
Companies spending below 5% of marketing budget on video struggle to support product complexity. Those exceeding 15% often over-invest in production quality without corresponding conversion improvements.
Budget Allocation Across Your SaaS Marketing Funnel
Strategic budget allocation distributes investment across awareness, consideration, and decision stages rather than concentrating spending on single hero explainer videos.
Awareness Stage Videos: How Much to Invest Upfront
Allocate 30-35% of annual video budget to awareness stage content driving top-of-funnel traffic and initial product interest.
Awareness video types and typical costs:
- Hero explainer video: $8,000-$15,000 for initial production
- Problem-solution videos: $5,000-$8,000 each
- Thought leadership content: $3,000-$6,000 per video
- Social media cuts from hero content: $1,500-$3,000 for adaptation
Before investing, get realistic about how much explainer videos actually cost when factoring in script development, technical review cycles, and revisions that SaaS products require.
Product Demo and Feature Videos: Ongoing Budget Requirements
Reserve 40-45% of budget for product demonstration and feature explanation videos that directly support trial conversions and sales cycles.
Product demo budget considerations:
- Core product demo requiring quarterly updates: $10,000-$18,000 annually
- Feature-specific videos for major releases: $4,000-$7,000 each
- Integration demos showing third-party connections: $5,000-$8,000 each
- Use case videos for different verticals: $6,000-$10,000 per vertical
Understanding quality differences between budget and premium explainer videos helps determine when to invest in custom demos versus using cost-effective template approaches for feature updates.
Customer Success and Onboarding Video Budgets
Dedicate 20-25% of budget to customer success videos that reduce churn, decrease support tickets, and drive feature adoption among existing users.
Customer success video investments:
- Interactive onboarding sequence: $12,000-$20,000 for complete flow
- Feature tutorial library: $2,500-$5,000 per tutorial
- Advanced tips and tricks videos: $3,000-$6,000 each
- Admin and setup guides: $4,000-$7,000 per guide
These videos deliver measurable ROI through support ticket reduction and improved activation rates among trial users.
The Multi-Video Reality: Planning Beyond Your First Explainer
Successful SaaS video strategies require 8-15 videos minimum to support complete buyer journeys, not the single hero explainer that many early-stage teams initially budget for.
Why One Video Never Solves All Your Needs
Single videos can’t simultaneously educate cold prospects, demonstrate product value to evaluators, support sales conversations, and onboard new customers.
Each audience needs different video content:
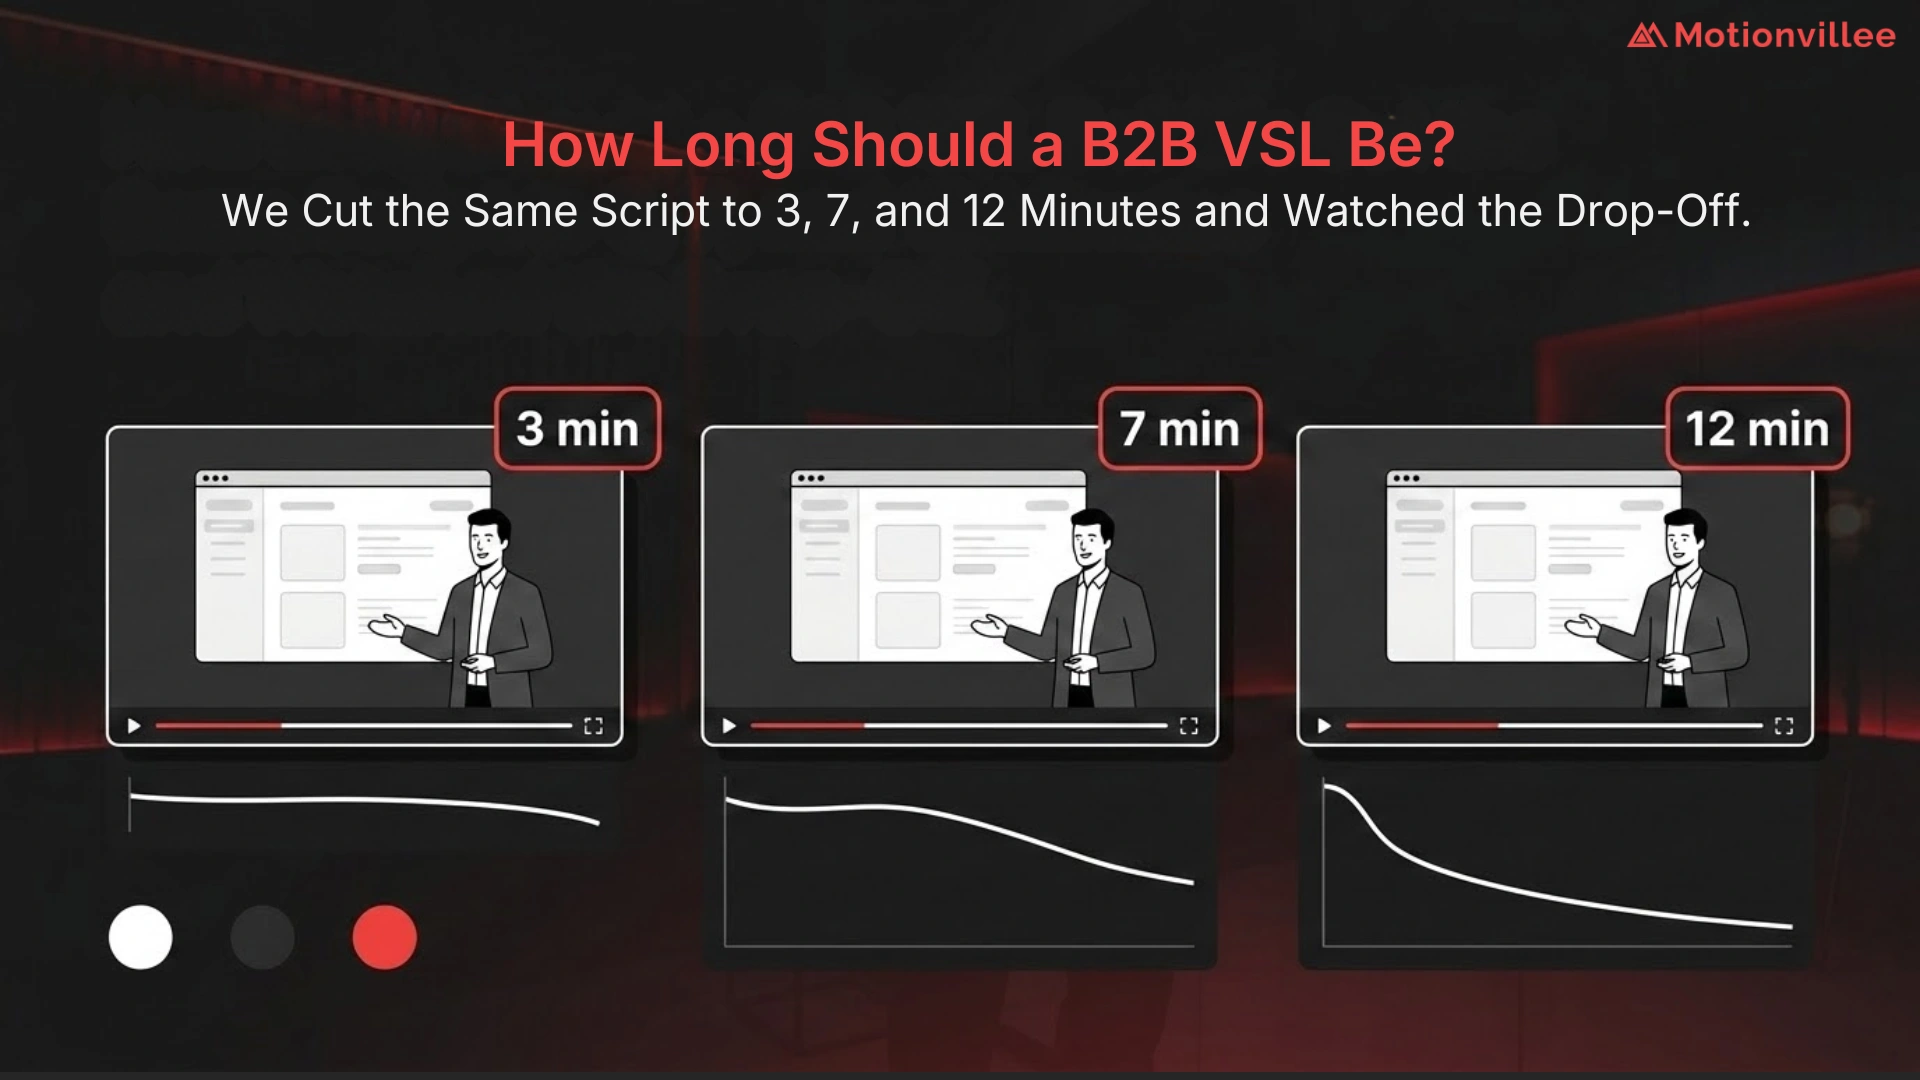
- Cold prospects require 60-90 second awareness videos explaining the problem
- Active evaluators need 2-3 minute product demos showing core workflows
- Sales prospects benefit from 5-10 minute technical deep dives
- New customers need step-by-step tutorials under 3 minutes each
Attempting to serve all audiences with one video results in content too long for awareness, too shallow for evaluation, and too generic for effective onboarding.
Building a Complete Video Library Over Time
Build your video library systematically over 12-18 months rather than attempting comprehensive coverage immediately.
Recommended build sequence:
- Quarter 1: Hero explainer and core product demo
- Quarter 2: Top 3 feature videos and onboarding sequence
- Quarter 3: Customer testimonials and use case videos
- Quarter 4: Advanced tutorials and sales enablement content
- Year 2: Vertical-specific demos and localized versions
This phased approach spreads investment while ensuring high-priority videos launch first.
Prioritizing Video Types by Business Impact
| Video Type | Business Impact | Priority Tier | Typical Investment |
|---|---|---|---|
| Hero Explainer | Paid acquisition efficiency, brand awareness | Tier 1 (Must Have) | $3,000-$10,000 |
| Product Demo | Trial conversions, sales cycle acceleration | Tier 1 (Must Have) | $3,000-$18,000 |
| Onboarding Videos | Activation rates, churn reduction | Tier 1 (Must Have) | $3,000-$25,000 |
| Feature Tutorials | Feature adoption, support ticket reduction | Tier 2 (High Value) | $3,000-$6,000 each |
| Customer Testimonials | Social proof, sales enablement | Tier 2 (High Value) | $3,000-$8,000 each |
| Vertical-Specific Demos | Market expansion, enterprise sales | Tier 3 (Growth Stage) | $3,000-$12,000 each |
SaaS-Specific Cost Factors That Inflate Your Budget
SaaS video production carries unique cost drivers that consumer product videos never encounter, inflating budgets by 40-60% compared to standard explainer video pricing.
Technical Accuracy Requirements and Subject Matter Expert Time
The technical accuracy verification adds 15-25% to production costs through extended review cycles and subject matter expert involvement.
Technical review impacts on budget:
- Product managers reviewing scripts add 8-12 hours internal time
- Engineering teams verifying technical accuracy contribute 5-8 hours
- Additional revision rounds for terminology precision
- Extended production timelines affecting project schedules
These costs don’t appear in standard vendor quotes but represent real internal expenses that SaaS teams must budget for.
Screen Recording Integration and UI Animation Complexity
Screen recordings and UI animation for SaaS demos cost 30-50% more than standard motion graphics because they require actual product interaction and precise workflow representation.
UI animation cost drivers:
- Screen recording coordination with product teams
- UI element animation matching actual product design
- Workflow accuracy verification across multiple user roles
- Integration of product updates during production
Working with professional video production services experienced in SaaS products reduces these complexities through established workflows for technical accuracy and UI animation.
Frequent Product Updates and Video Refresh Cycles
SaaS products updating every 2-4 weeks require video refresh budgets that consumer products never need, adding 25-40% annually to maintain accuracy.
Video refresh budget requirements:
- Minor UI updates requiring screen recording refreshes: $1,500-$3,000 per video
- Feature additions changing core workflows: $3,000-$6,000 per video
- Major product redesigns requiring full reproduction: $8,000-$12,000 per video
- Quarterly review and update cycles across video library
Budget planning must include ongoing refresh costs, not just initial production investment.
Budget Planning by Growth Stage
Video budget requirements scale with company stage, but strategic allocation matters more than absolute dollar amounts at every stage.
Pre-Seed and Seed Stage: Bootstrap Video Strategies
Early-stage SaaS companies with limited budgets should invest $15,000-$35,000 in Year 1 video, focusing exclusively on conversion-critical content.
Seed stage budget allocation:
- 60% to hero explainer supporting paid acquisition
- 30% to basic product demo for trial conversions
- 10% to simple onboarding video reducing early churn
Understanding what founders should know about explainer video costs prevents early-stage teams from either under-investing in quality or over-spending on unnecessary production polish.
Avoid these seed stage mistakes:
- Don’t create customer testimonials before achieving product-market fit
- Skip vertical-specific content until you identify your ICP
- Delay localization until proven domestic market success
A and B Series: Scaling Video Production Sustainably
A Series companies should budget $35,000-$75,000 annually, expanding from core videos to supporting full marketing funnel with strategic video content.
A Series expansion priorities:
- Refresh hero explainer with improved positioning from market learnings
- Create 3-5 feature videos for key product capabilities
- Develop customer testimonial video from successful customers
- Build basic tutorial library for top support questions
B Series companies at $75,000-$150,000 annual budgets should add:
- Vertical-specific demos for primary market segments
- Sales enablement videos supporting enterprise deals
- Integration videos showing ecosystem connections
- Regular feature launch videos for product marketing
When evaluating vendors, review how to choose the right explainer video pricing model for your B2B budget to determine whether fixed packages, custom quotes, or retainer arrangements best serve your scaling needs.
Growth Stage and Beyond: Enterprise Video Program Budgets
Growth stage SaaS companies at $20M+ ARR typically invest $150,000-$300,000+ annually through structured video programs supporting global operations and enterprise sales motions.
Enterprise video program components:
- Dedicated video production partner on annual retainer
- Quarterly video roadmap aligned with product launches
- Localization budget for 3-5 primary markets
- Continuous refresh cycle maintaining content accuracy
- Advanced analytics tracking video impact on pipeline
At this stage, companies often maintain hybrid models combining retainer relationships with specialized project work for major initiatives.
Internal vs External Production Cost Analysis
SaaS teams must decide between building internal video capabilities, outsourcing all production, or implementing hybrid models based on volume requirements and quality standards.
When Building In-House Video Capabilities Makes Sense
In-house video teams become cost-effective when producing 15+ videos annually with consistent quality requirements and dedicated personnel.
| Cost Factor | In-House Annual Cost | Outsourced Annual Cost (15 videos) |
|---|---|---|
| Video Producer Salary | $85,000-$110,000 | N/A |
| Motion Designer Salary | $75,000-$95,000 | N/A |
| Equipment and Software | $15,000-$25,000 | N/A |
| Production Costs (15 videos) | N/A | $90,000-$150,000 |
| Total First Year | $175,000-$230,000 | $90,000-$150,000 |
In-house teams require 18-24 months to reach break-even compared to outsourcing. They make sense only when video volume consistently exceeds 15 projects annually.
Hybrid Models: Strategic Outsourcing for Maximum Efficiency
Hybrid models combining limited internal resources with strategic outsourcing deliver optimal cost efficiency for most growth-stage SaaS companies.
Effective hybrid model structure:
- Internal: One video producer managing strategy, coordination, and simple updates
- Outsourced: Complex animation, hero content, and specialized production
- Internal: Screen recordings, basic tutorials, product update videos
- Outsourced: Brand videos, testimonials, and high-polish sales content
Partnering with experienced explainer video production partners for complex projects while handling routine updates internally maximizes budget efficiency.
True Cost of DIY Including Opportunity Cost
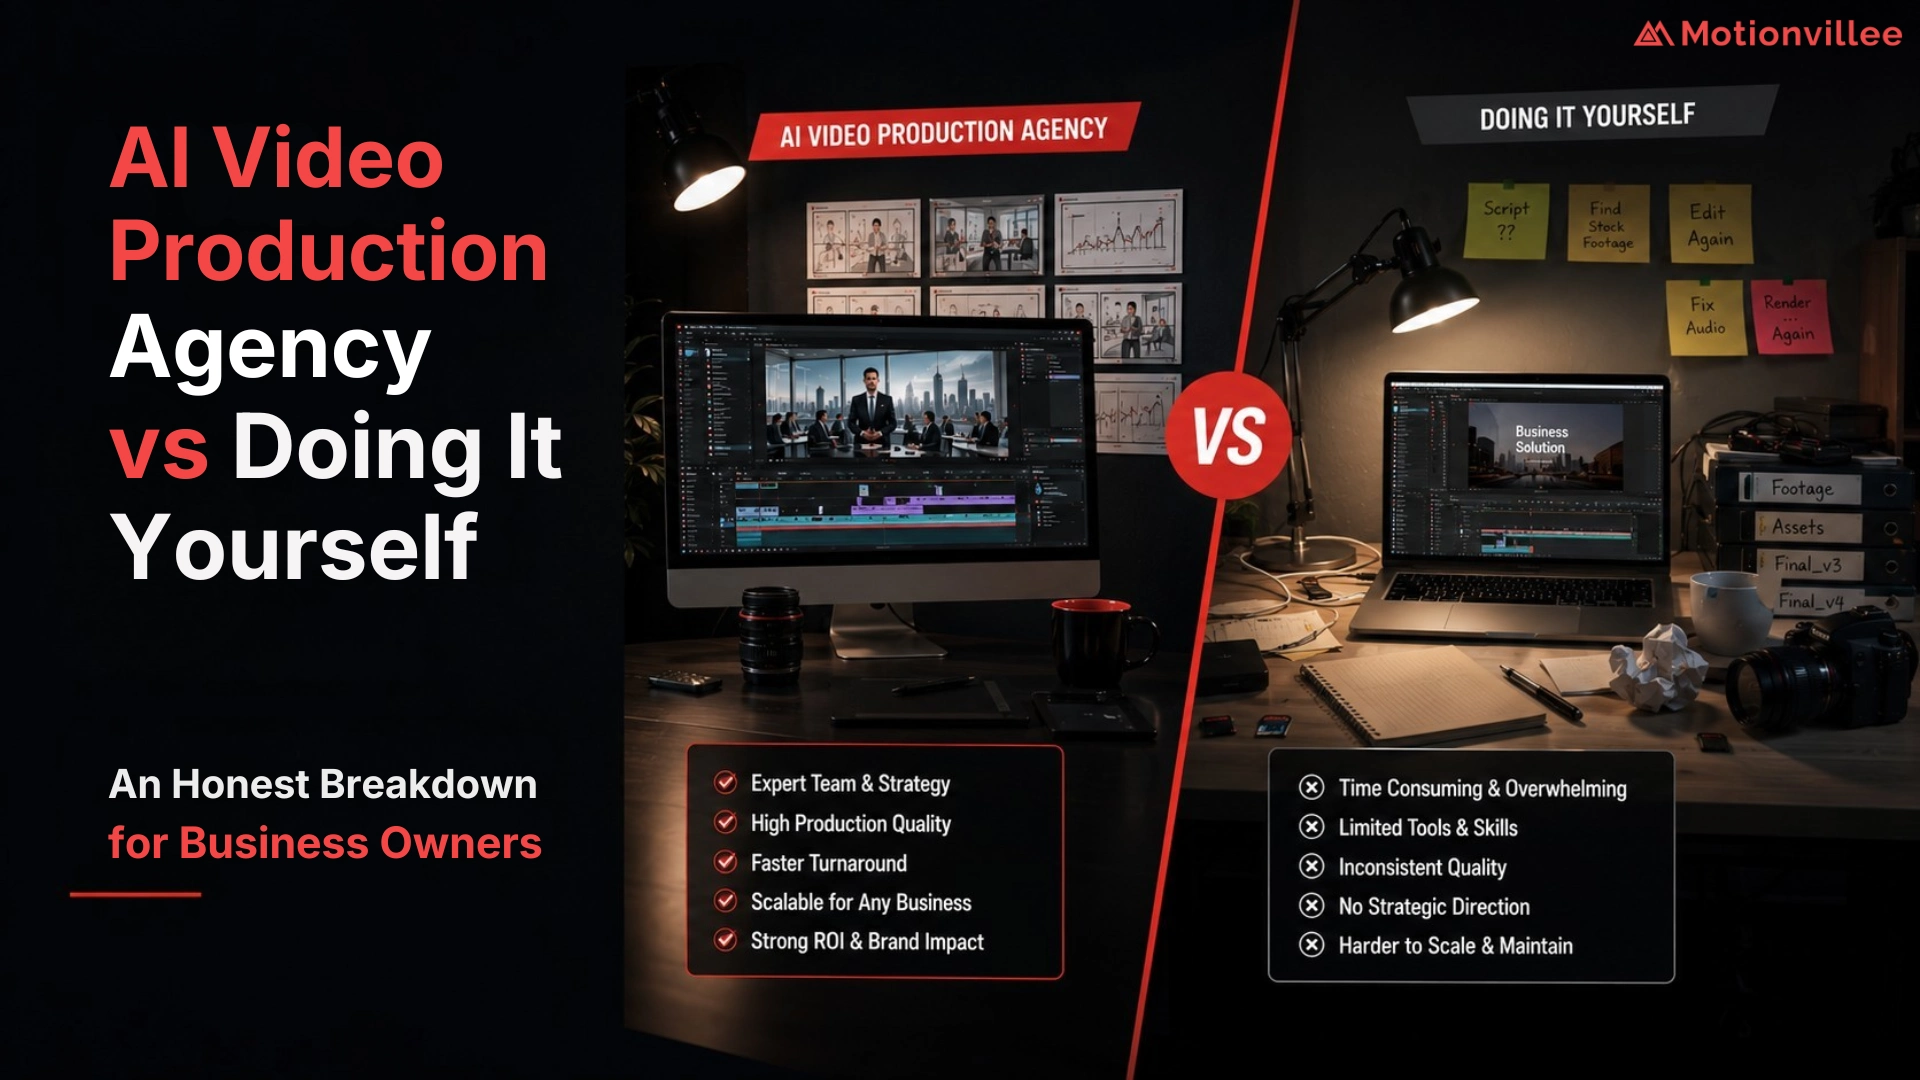
DIY video production by product marketers or designers carries hidden costs through opportunity cost, learning curves, and inconsistent quality that damages brand perception.
Hidden DIY costs beyond obvious time investment:
- Product marketer spending 40 hours on video instead of strategy work
- Learning curve producing lower quality than professional alternatives
- Inconsistent branding across videos created by different team members
- Technical limitations preventing effective product demonstration
Calculate opportunity cost by multiplying hours spent by your team’s effective hourly rate. A product marketer earning $120K annually has an effective rate of $60/hour, making 40-hour DIY video projects cost $2,400 in opportunity cost alone.
Annual Video Budget Framework for SaaS Marketing Teams
Structured annual video budgets allocate resources across quarters based on product launch calendars, seasonal demand patterns, and strategic marketing initiatives.
Calculating Your Video Budget as Percentage of Marketing Spend
SaaS companies should allocate 8-12% of total marketing budget to video content, with percentages varying based on product complexity and go-to-market strategy.
Budget percentage by GTM motion:
- Product-led growth (PLG): 10-12% due to onboarding and tutorial needs
- Sales-led growth: 8-10% focused on demos and enablement content
- Hybrid PLG + sales: 9-11% supporting both self-service and sales motions
Calculate baseline budget by multiplying annual marketing spend by appropriate percentage, then adjust based on specific video needs and growth stage.
Quarterly Budget Distribution and Seasonal Considerations
Distribute annual video budget unevenly across quarters to align with product launches, campaign calendars, and budget approval cycles.
Recommended quarterly distribution:
- Q1: 30% (major campaigns launching, annual planning fresh)
- Q2: 25% (product updates, conference preparation)
- Q3: 20% (summer slowdown, planning for Q4)
- Q4: 25% (year-end pushes, budget utilization)
Understanding the cost of launching without an explainer video helps justify front-loading Q1 budget to ensure critical content launches on time.
Building Budget Buffers for Unplanned Video Needs
Reserve 15-20% of annual video budget as buffer for unplanned needs including competitive responses, crisis communications, and unexpected product launches.
Situations requiring buffer budget:
- Competitor launches similar feature requiring immediate response video
- Product bug or outage necessitating customer communication video
- Unexpected partnership or integration announcement
- Executive request for conference or event content
Teams without buffer budgets either delay critical video needs or cannibalize planned projects to fund urgent requirements.
ROI Expectations That Justify Your Video Investment
Video investments deliver measurable ROI through conversion rate improvements, sales cycle reduction, and support cost savings that justify budgets to finance stakeholders.
Conversion Rate Improvements Worth Measuring
Well-executed explainer videos improve landing page conversion rates by 25-40% and trial-to-paid conversion by 15-25%.
Conversion metrics to track:
- Landing page conversion rate before and after video addition
- Trial signup rate on pages with versus without video
- Trial activation rate for users viewing onboarding videos
- Feature adoption rate with tutorial video support
Calculate ROI by multiplying conversion improvement percentage by annual traffic volume and average customer value.
Sales Cycle Reduction and Pipeline Velocity Gains
Product demo videos reduce average sales cycle length by 10-20% by answering technical questions earlier in buyer journeys.
Sales cycle impact measurement:
- Average days from first contact to close before video implementation
- Sales cycle length for prospects engaging with video content
- Number of sales meetings required with versus without video
- Win rates for opportunities where prospects watched demo videos
Even 10% sales cycle reduction delivers substantial value when average deals take 90-120 days to close.
Support Ticket Reduction From Educational Video
Tutorial video libraries reduce support ticket volume by 20-30%, directly decreasing support costs while improving customer satisfaction.
Calculate support cost savings:
- Identify average support ticket cost (typically $15-$25)
- Measure ticket volume reduction after tutorial video launch
- Multiply tickets saved by average resolution cost
- Annualize savings across all tutorial videos
Companies with high support costs often achieve video ROI through ticket reduction alone, independent of marketing benefits.
Common SaaS Video Budget Mistakes and How to Avoid Them
Most SaaS teams make predictable budget mistakes that waste investment through poor planning, underestimation of true costs, or misaligned priorities.
Underestimating the Need for Multiple Versions
Budgeting for single video versions without accounting for aspect ratio variations, caption formats, and length adaptations wastes opportunities across distribution channels.
Version requirements typically include:
- 16:9 landscape for website and YouTube
- 1:1 square for Instagram and LinkedIn
- 9:16 vertical for TikTok and Instagram Stories
- 30-second and 15-second cuts for paid ads
- Captioned versions for sound-off viewing
Budget $1,500-$3,000 per video for version creation, or negotiate version packages with production partners upfront.
Ignoring Localization Costs for Global Expansion
International expansion requires localization budgets that early-stage teams often overlook, adding 40-60% to video costs per additional market.
Localization cost components:
- Professional translation services: $150-$300 per minute of video
- Native voice talent: $500-$1,200 per video depending on language
- Cultural adaptation ensuring messaging resonates: 5-10 hours creative time
- Quality review by native speakers: $200-$400 per video
Plan localization budgets when entering new markets, not as afterthought requiring emergency funding.
Front-Loading Budget Without Planning for Updates
Spending entire annual video budget in Q1 and Q2 leaves no resources for product updates, feature launches, or market changes in second half of year.
Sustainable budget pacing strategies:
- Never commit more than 35% of annual budget in any single quarter
- Reserve minimum 20% for second-half product updates
- Build quarterly review checkpoints before releasing next quarter budget
- Maintain rolling 90-day video roadmap aligned with product calendar
Building Your Business Case for Video Budget Approval
Securing video budget approval from CFOs and finance teams requires data-driven business cases demonstrating ROI potential and competitive necessity.
Financial Projections That Persuade CFOs
Build financial projections showing payback period, customer acquisition cost reduction, and lifetime value improvements attributable to video investment.
CFO-friendly metrics to include:
- Payback period calculation (typically 6-12 months for SaaS video)
- CAC reduction from improved conversion rates
- LTV increase through better onboarding and lower churn
- Support cost savings from tutorial video library
Present conservative projections using 50% of industry benchmark improvements to build credibility with finance stakeholders.
Competitive Analysis: What Your Competitors Invest
Document competitor video investments and content quality to demonstrate market expectations and competitive disadvantage of underinvestment.
Competitive analysis components:
- Count of videos competitors maintain across channels
- Production quality assessment versus your current content
- Content types competitors produce that you lack
- Estimated investment levels based on visible video volume
Showing that competitors invest 2-3x your proposed budget creates urgency around competitive parity.
Phased Approach to De-Risk Large Video Investments
Propose phased video programs starting with pilot projects that prove ROI before requesting full annual budget commitment.
Three-phase budget request structure:
- Phase 1: Pilot with hero explainer and basic demo ($15,000-$25,000)
- Phase 2: Expand to feature videos and tutorials based on Phase 1 results ($25,000-$40,000)
- Phase 3: Full video program with ongoing production ($50,000-$75,000 annually)
Incremental commitment reduces perceived risk while demonstrating video impact through measurable results at each phase.
Strategic Budget Planning for Sustainable Video Success
SaaS explainer video budget planning requires strategic allocation beyond simple project quotes. Successful teams allocate 8-12% of marketing spend across awareness, product demo, and customer success videos while maintaining buffers for unplanned needs.
Key budget planning principles:
- Plan for 8-15 videos minimum, not single hero explainer
- Budget ongoing refresh costs for product updates
- Distribute spending across quarters aligned with launches
- Reserve 15-20% buffer for unexpected video needs
Growth stage determines appropriate investment levels, but strategic allocation matters more than absolute dollars. Seed stage companies succeed with focused $15,000-$35,000 investments in conversion-critical content. Growth stage teams require $150,000+ supporting enterprise programs.
Measure ROI through conversion improvements, sales cycle reduction, and support cost savings to justify continued investment. Build business cases using conservative projections and competitive analysis to secure CFO approval.
Schedule a strategy call with Motionvillee to develop your customized SaaS video budget plan aligned with your growth stage, product complexity, and go-to-market strategy.