The Silent Revenue Leak: When Complex Products Confuse Before They Convert
Your product solves real problems, your engineers built sophisticated capabilities, and your features outperform competitors. But prospects ghost after demos, evaluation cycles stall at technical review, and qualified pipeline evaporates without clear explanation.
Product complexity revenue loss is the silent killer hiding in your conversion metrics. It doesn’t show up as objections. It appears as “still evaluating,” “need more time,” and “we’ll circle back next quarter.” Prospects don’t say they’re confused. They simply stop responding.
Complexity costs B2B companies 30-40% of qualified pipeline before buyers articulate a single objection. The damage happens in silence.
What Is Product Complexity Revenue Loss?
Product complexity revenue loss is qualified pipeline that dies from buyer confusion rather than product deficiencies, occurring when prospects can’t understand value clearly enough to justify purchase despite genuine need and budget.
This isn’t lost deals to competitors or price objections. Those losses have clear causes. Complexity loss is different. Prospects have the problem, budget exists, your solution fits. But they can’t confidently explain your value internally, so they default to “not now.”
The deal doesn’t close. It doesn’t get rejected. It just fades. That’s the signature of complexity-driven revenue loss.

Why Don’t Prospects Just Ask For Clarification?
Prospects don’t ask for clarification because confusion signals their own inadequacy rather than your poor explanation, enterprise buyers avoid appearing uninformed to vendors, and confused buyers ghost instead of admitting they don’t understand.
The Self-Blame Dynamic
When prospects don’t understand your product, they blame themselves, not you. “Maybe I’m not technical enough.” “Perhaps this isn’t for someone at my level.” “I probably need to learn more about this category first.”
This self-blame prevents clarification requests. Asking feels like admitting incompetence.
The Professional Persona Protection
Enterprise buyers maintain professional personas. Admitting confusion to vendors threatens that persona. Especially in group settings like demos, buyers won’t ask basic questions that reveal knowledge gaps.
So they nod along, take notes, and research independently later. Often unsuccessfully. Understanding how to make your SaaS product easy to understand eliminates this barrier.
The Silent Exit Pattern
Confused buyers don’t schedule another meeting to get clarity. They stop responding to emails. Your follow-ups get polite deflections. “We’re still reviewing internally.” Translation: “We’re confused and haven’t figured out next steps.”
By the time you realize they’re confused, they’ve mentally moved on.
How Do You Know If Complexity Is Killing Your Conversions?
Complexity kills conversions when qualified opportunities stall without objections, prospects request excessive follow-up materials, evaluation cycles stretch beyond forecasted timelines, and deals die in technical review despite strong business case alignment.
The Stall Without Objection Pattern
Review your stalled deals. If prospects cite specific concerns like price, features, or competition, those aren’t complexity losses. But if deals stall with vague reasoning like “need more time to evaluate” or “still building internal consensus,” confusion is likely.
Vague stall reasons mask underlying confusion.
The Material Request Spiral
After demos, prospects request slide decks, technical documentation, comparison sheets, and ROI calculators. You send everything. They request more materials. This infinite information loop signals they don’t have the foundational understanding needed to evaluate.
More materials rarely solve fundamental confusion.
The Extended Evaluation Syndrome
You forecasted 60-day sales cycles. Deals are taking 120 days. The extra time isn’t productive evaluation. It’s prospects struggling to understand basics well enough to make decisions.
Complexity doubles sales cycles by forcing prospects to educate themselves repeatedly. This is why explainer videos that simplify complex products reduce cycle length significantly.
The Technical Review Black Hole
Deals reach technical review and disappear. Your technical documentation is comprehensive. Your architecture is sound. But technical stakeholders get lost in complexity and never emerge with clear recommendations.
Technical review should validate capabilities, not become an education obstacle course.
What Makes B2B Products Confusing to Qualified Buyers?
B2B products become confusing when they involve too many concepts requiring explanation, use terminology buyers don’t understand, solve problems buyers don’t recognize, or explain features before establishing relevance context.
The Concept Overload Problem
Your product requires understanding five new concepts before grasping basic value. API management requires understanding APIs, management platforms, gateway architecture, rate limiting, and analytics frameworks.
Each concept builds on the previous. Prospects missing one foundation piece can’t understand anything after.
The Terminology Barrier
You say “observability platform.” Prospects hear technical jargon they don’t fully understand. You say “workflow orchestration.” They’re translating in their heads instead of evaluating value.
Every unfamiliar term is cognitive friction slowing comprehension.
The Invisible Problem Challenge
Your product solves problems prospects don’t recognize. Security vulnerabilities they don’t know exist. Process inefficiencies they’ve normalized. Technical debt they’ve accepted as inevitable.
Before prospects understand your solution, they need to understand they have the problem. Learning how to explain complex products in 90 seconds requires starting with problem validation.
The Feature-First Mistake
You lead with what your product does instead of why it matters. “We provide real-time data synchronization across distributed systems.” Technical accurate. Strategically meaningless to non-technical buyers.
Features are proof points. Benefits establish relevance first.
How Much Revenue Does Complexity Actually Cost?
Product complexity costs B2B companies 30-40% of qualified pipeline value, extends sales cycles by 40-60%, and reduces win rates from 25-30% to 15-20% when buyers can’t confidently understand and articulate value.
The Pipeline Mortality Calculation
If you generate $5M in qualified annual pipeline and lose 35% to confusion, that’s $1.75M in silent revenue loss. Not to competitors. Not to budget constraints. To complexity.
Most companies attribute these losses to “not ready” or “timing issues.” The real cause is buyer confusion.
The Sales Cycle Cost
Your forecasted 60-day cycle becomes 90 days because prospects need extra time understanding basics. That’s 50% longer, meaning 33% fewer deals closed per rep annually with the same resources.
Complexity doesn’t just kill deals. It reduces sales capacity.
The Win Rate Impact
Clear value propositions convert at 25-30%. Complex products convert at 15-20%. That’s 35-40% lower win rates solely from comprehension barriers.
Same product. Same buyers. Different clarity levels. Dramatic conversion differences.
Why Does Complexity Hit Technical Products Hardest?
Complexity hits technical products hardest because they assume buyer technical knowledge they rarely have, solve invisible problems requiring education, and explain mechanisms before establishing outcomes.
The Knowledge Assumption Gap
Your product targets DevOps teams, so you explain it using DevOps terminology. But your buyer is a VP of Engineering who hasn’t written code in five years. They nod along, pretending to understand.
Targeting technical audiences doesn’t mean all stakeholders are technical.
The Invisible Technical Debt
Your product eliminates technical debt prospects don’t realize exists. Performance bottlenecks they’ve accommodated. Security vulnerabilities they haven’t discovered. Scalability limitations they haven’t hit yet.
Invisible problems need visible proof before prospects invest in solutions.
The Mechanism vs Outcome Confusion
You explain how your technology works instead of what outcomes it creates. “We use machine learning algorithms to analyze patterns.” Okay, but what does that mean for their business?
Mechanisms are interesting. Outcomes drive purchase decisions. Understanding the video design process for simplifying complexity helps translate mechanisms into outcomes.
What’s The Difference Between Complexity and Sophistication?
Sophistication delivers advanced capabilities that solve real problems while remaining comprehensible, whereas complexity creates confusion regardless of capability value, often from poor explanation rather than inherent product difficulty.
Sophisticated: Advanced but Clear
Tesla’s autopilot is sophisticated engineering. But the value prop is simple: “The car drives itself on highways.” Advanced capability explained clearly.
Prospects immediately understand the value, even if they don’t understand the technical implementation.
Complex: Confusing Regardless of Value
“Our platform leverages proprietary algorithms to optimize multi-dimensional data structures across distributed architectures.” This could solve real problems. But nobody knows what problems or why they should care.
Complexity is usually explanation failure, not product failure.
The Clarity Test
Can someone unfamiliar with your category explain your value after one conversation? If yes, you’ve achieved sophisticated clarity. If no, you’re delivering complexity.
Clarity is the prospect’s experience, not your intent.
How Does Visual Communication Reduce Complexity Loss?
Visual communication reduces complexity loss by showing instead of telling, demonstrating relationships that resist verbal explanation, and compressing complex information into digestible visual sequences that reduce cognitive load.
The “Show Don’t Tell” Advantage
Describing your data flow architecture takes 10 minutes of explanation. Showing it visually takes 30 seconds and creates immediate comprehension.
Visuals bypass verbal translation. Understanding happens directly.
The Relationship Visualization
Some concepts are inherently visual. How systems integrate. Where data flows. How workflows connect. These relationships resist clear verbal explanation but become obvious visually.
Words describe. Visuals demonstrate.
The Cognitive Load Reduction
Processing visual information requires less mental effort than translating text descriptions into mental models. Video lets prospects absorb complexity while expending less cognitive energy.
Lower cognitive load means better comprehension and retention. This is why animated explainer videos boost conversions for complex products.
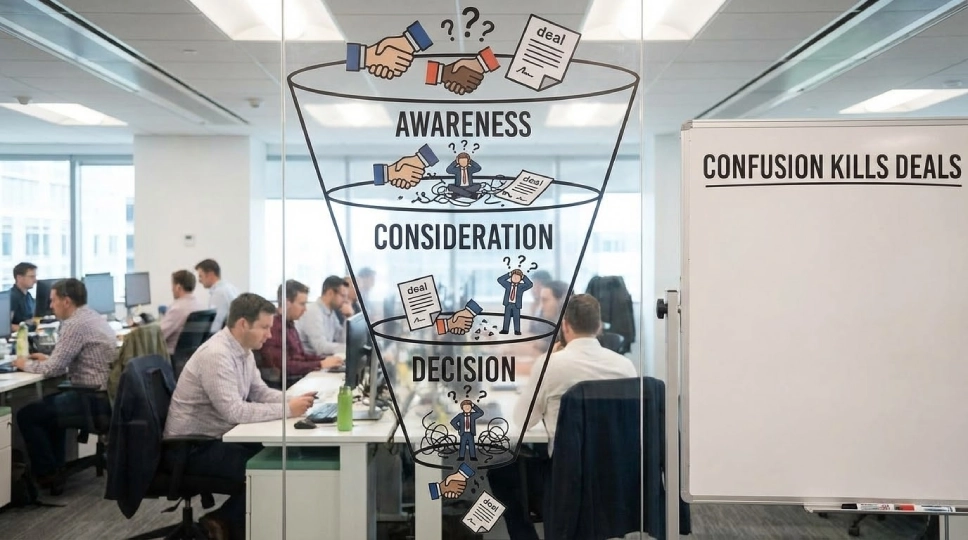
What Type of Confusion Kills Deals at Each Funnel Stage?
Different confusion types kill deals at different stages: problem confusion at awareness, solution confusion at consideration, differentiation confusion at evaluation, and implementation confusion at decision.
Awareness Stage: Problem Confusion
“Do we actually have this problem?” Prospects aren’t convinced the issue you solve exists or matters enough to address.
Fix: Make the problem visible before explaining your solution.
Consideration Stage: Solution Confusion
“How does this type of solution work?” Prospects don’t understand the solution category well enough to evaluate options.
Fix: Educate on the category, not just your product.
Evaluation Stage: Differentiation Confusion
“How is this different from alternatives?” Prospects can’t distinguish your approach from competitors’ approaches.
Fix: Clearly articulate unique mechanisms and outcomes. Understanding what sales impact to expect at each stage helps target the right clarity.
Decision Stage: Implementation Confusion
“How does this actually work in our environment?” Prospects can’t visualize implementation, so they fear unknown complexity.
Fix: Show specific implementation path for their situation.
How Do You Diagnose Which Complexity Type You Have?
You diagnose complexity type by analyzing where deals stall, what questions prospects ask repeatedly, what materials they request, and which stakeholders express confusion.
The Stall Point Analysis
Review your last 20 stalled deals. Note the pipeline stage where momentum stopped. Patterns reveal complexity type.
Stalls at discovery? Problem confusion. Stalls at evaluation? Differentiation confusion. Stalls at decision? Implementation confusion.
The Repeated Question Audit
Document every question prospects ask more than once. Repeated questions signal persistent confusion areas.
“How is this different from [competitor]?” = Differentiation confusion. “What exactly does this do?” = Solution confusion. “Do we really need this?” = Problem confusion.
The Material Request Pattern
What collateral do prospects request most? Case studies = proof confusion. Technical docs = implementation confusion. Comparison sheets = differentiation confusion.
Material requests reveal hidden uncertainty.
What Makes Some Industries More Complexity-Prone?
Industries with high complexity risk include developer tools, infrastructure software, security platforms, data analytics, and any category requiring technical knowledge to evaluate properly.
Developer Tools
Buyers need technical depth to evaluate. But procurement and budget holders aren’t always technical. This creates knowledge gaps between users and buyers.
Infrastructure Software
Value is invisible. Infrastructure prevents problems rather than solving visible ones. Proving ROI for prevention is inherently harder than proving ROI for solutions.
Security Platforms
Benefits are risk reduction. How do you value attacks that never happened? Complexity comes from justifying spend on invisible protection.
Data Analytics
Requires understanding data concepts, statistical methods, and business application simultaneously. Three knowledge domains create triple complexity risk. This is why SaaS video production services specializing in technical product simplification are essential.
How Do You Simplify Without Oversimplifying?
You simplify without oversimplifying by starting with outcomes before mechanisms, using analogies from familiar domains, showing real examples instead of abstract concepts, and layering depth progressively.
The Outcome-First Approach
Start with business impact. “We reduce security incident response time from 6 hours to 15 minutes.” Now prospects care. Then explain how.
Outcome establishes relevance. Mechanism satisfies curiosity after relevance is clear.
The Familiar Analogy Method
Connect new concepts to familiar experiences. “Think of our platform like air traffic control for your data pipelines.” Instant comprehension through familiar reference points.
Analogies create shortcuts to understanding.
The Progressive Depth Model
Deliver understanding in layers. 90 seconds: Core value. 3 minutes: How it works. 10 minutes: Technical depth. Prospects choose their depth based on need.
Everyone gets enough understanding. Technical buyers get additional depth when desired. Understanding script building blocks that convert helps structure this progression.
What Role Do Customer Success Stories Play in Clarity?
Customer success stories reduce complexity by providing concrete examples of abstract concepts, validating that other buyers understood and succeeded, and demonstrating real-world application instead of theoretical capability.
The Concrete Example Advantage
Abstract: “We optimize resource allocation.” Concrete: “LogisticsCo reduced delivery delays by 40% in 60 days.” The story makes the abstract tangible.
Stories show real people solving real problems with your product.
The Social Proof Shortcut
If CompanyX understood your product well enough to buy and succeed, prospects feel safer proceeding despite some remaining confusion. Social proof compensates for comprehension gaps.
“They figured it out, so can we” reduces perceived risk.
The Application Demonstration
Case studies show your product in action within specific contexts. This answers “How would this work for us?” more effectively than feature descriptions.
Application context makes capabilities meaningful.
How Do You Measure Clarity Improvement?
You measure clarity improvement by tracking sales cycle length changes, conversion rate improvements at confusion-prone stages, reduction in follow-up material requests, and increased buyer confidence scores.
The Sales Cycle Metric
If clarity improvements work, sales cycles shorten. Measure average cycle time before and after clarity interventions. Target 20-30% reduction.
Clearer value propositions reduce decision time.
The Stage Conversion Rates
Track conversion rates at each pipeline stage. If complexity hits technical review, that stage should show the biggest improvement from clarity fixes.
Stage-specific measurement reveals where clarity interventions work best.
The Material Request Frequency
Count how often prospects request additional explanatory materials post-demo. Fewer requests signal better initial comprehension.
Self-sufficient prospects indicate successful clarity.
The Buyer Confidence Score
Ask prospects post-demo: “How confident are you that you understand how our solution works?” Track scores before and after clarity improvements.
Confidence correlates strongly with conversion.
What’s The Biggest Mistake Companies Make Addressing Complexity?
The biggest mistake is adding more information instead of creating better clarity, assuming comprehensive documentation solves confusion when clear explanation is needed.
The Information Overload Response
Prospects are confused, so you create more detailed documentation, longer demos, and additional collateral. This adds information without adding clarity.
More content rarely solves fundamental comprehension problems.
The Technical Depth Trap
You assume prospects need technical depth to understand. But most need conceptual clarity first. Technical depth before conceptual clarity creates more confusion.
Depth is valuable after foundational understanding exists.
The Expert Bias
You’re an expert, so you explain from expert perspective using expert language. But prospects are beginners needing beginner-level clarity.
Curse of knowledge prevents you from seeing your own complexity. This is exactly why every SaaS product needs explainer videos created with buyer perspective.
How Long Does It Take to Fix Complexity-Driven Revenue Loss?
Fixing complexity-driven revenue loss takes 60-90 days from diagnosis through creating clarity materials, training sales, and measuring improved conversion, with ongoing optimization thereafter.
Month 1: Diagnosis and Planning
Identify where complexity hits hardest. Interview lost deals. Analyze stall points. Create clarity plan targeting highest-impact confusion areas.
Month 2: Content Creation
Produce clarity materials. Explainer videos for problem/solution understanding. Demo videos for application clarity. Technical overviews for implementation confidence.
Working with explainer video production services accelerates quality content creation.
Month 3: Implementation and Measurement
Train sales on new materials. Integrate clarity content into sales process. Measure conversion changes at previous confusion points.
Ongoing: Optimization
Refine based on data. Update materials as product evolves. Maintain clarity as complexity creeps back in.
What Happens When You Ignore Complexity Revenue Loss?
Ignoring complexity revenue loss creates compounding damage: sales cycles lengthen, win rates decline, sales team morale drops from unexplained losses, and marketing spend increases to compensate for poor conversion.
The losses compound quarterly. Each confused prospect takes longer to convert or never converts. Your team works harder for worse results. Marketing increases spend to generate more top-funnel volume, but conversion problems remain.
Eventually, you blame your product, your pricing, your market. The real problem was always clarity.
Your complex product doesn’t need oversimplifying. It needs clarity. Within 90 days, you can identify your highest-impact confusion points, create visual clarity materials, and measure conversion improvements.
Your sales cycles shorten because prospects understand faster, win rates improve because buyers can confidently articulate value internally, and your pipeline stops leaking from silent confusion.
The companies winning complex product sales in 2026 aren’t simplifying their products. They’re simplifying their explanations. Working with video production teams in the USA who specialize in technical product clarity helps you join them.
Ready to stop losing deals to confusion? Let’s identify where complexity costs you revenue and create clarity that converts.