31 Animated Explainer Video Facts Every Marketer Should Know in 2026
Numbers tell the story better than any pitch.
These 31 animated explainer video facts are drawn from the most recent research available, covering viewer behavior, conversion rates, ROI benchmarks, production trends, and what’s changing in 2026. Whether you’re planning your first video or scaling a content strategy, this is the data that should be driving your decisions.
Viewer Behavior
These animated explainer video facts show how people actually engage with video content today.
- 96% of people have watched an explainer video to learn more about a product or service
- 85% of people have been convinced to buy a product or service after watching a video
- 63% of people say they’d most like to watch a short video to learn about a product, more than any other format
- 84% of consumers want to see more video content from brands in 2026
- Viewers retain 95% of a message when watching it in video form, compared to just 10% when reading text
- 80% of people have bought or downloaded an app after watching a video about it
- 75% of all video viewing now happens on mobile devices
- 85% of mobile videos are watched without sound, making captions essential, not optional (Insivia)
- 68% of users prefer to watch a video to solve a product problem instead of calling support
- 64% of online buyers decided to make a purchase after watching a brand video on social media
These numbers reflect a consistent pattern in video marketing statistics, people watch to learn, decide, and buy.
Conversion and Business Impact
This is where animated explainer video facts get interesting for anyone running a pipeline.
- Landing pages with explainer videos convert 86% better than pages without video
- The average conversion rate on websites with video is 4.8%, compared to 2.9% on websites without it
- Product pages with video see 47% higher engagement rates
- Video content can increase conversion rates by up to 80%
- Explainer videos can reduce product returns by 35%
- Marketers report 66% more qualified leads annually from explainer video campaigns
- Video content is 50 times more effective at driving search results compared to plain text
- Businesses are 53 times more likely to appear on Google’s first page when using video on their pages
- Emails with video see 300% better click rates than those without
- 97% of marketers say an explainer video helped users better understand their product or service
To see what this data looks like applied to real campaigns, reviewing explainer video examples and strategy shows the structure behind videos that produced these kinds of results.
Production and Format
These animated explainer video facts cover the decisions teams make during production.
- 68% of video marketers created explainer videos in 2026, the second most popular video type after social media clips
- 91% of businesses now use video as a marketing tool
- 59% of companies create video in-house, while 32% use a mix of internal teams and external vendors
- 60-90 seconds is the ideal explainer video length for maximum retention
- Average video length has shrunk from 168 to 76 seconds since 2016 and is expected to reach 39 seconds by 2026
- A 60-90 second explainer video takes an average of 4-6 weeks to produce from scratch
- 37% of marketers use animated explainer videos specifically to translate complex concepts into visual narratives
- 63% of video marketers have used AI tools to help create or edit marketing videos in 2026, up from 51% in 2025
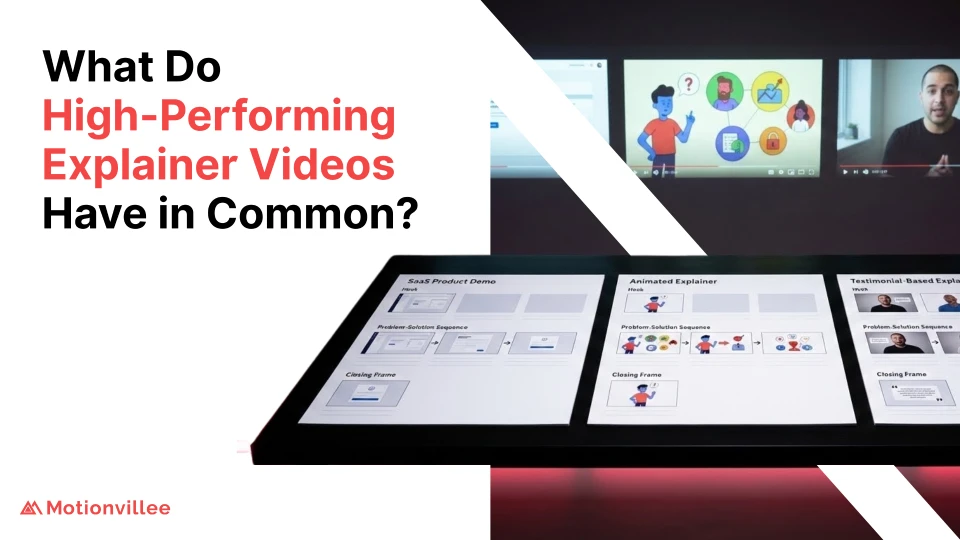
Understanding what makes a video high-performing helps you apply these production benchmarks to your own content rather than just collecting them as data points.
ROI and Investment
- 90% of marketers report a positive ROI from video marketing
- 82% of marketers say video has given them good ROI in 2026
- Digital video ad spending exceeded $62 billion in 2024, a 16% increase year over year, and it continues to rise
For a deeper look at what these returns look like on a per-campaign basis, reading the explainer video ROI data breaks down the numbers behind specific video investments.
And to understand where the format is heading next, exploring the latest explainer video trends shows what’s changing in production, format, and distribution right now.
What These Facts Tell You
The data isn’t subtle. Animated explainer videos consistently outperform other content formats on conversion, retention, lead generation, and ROI.
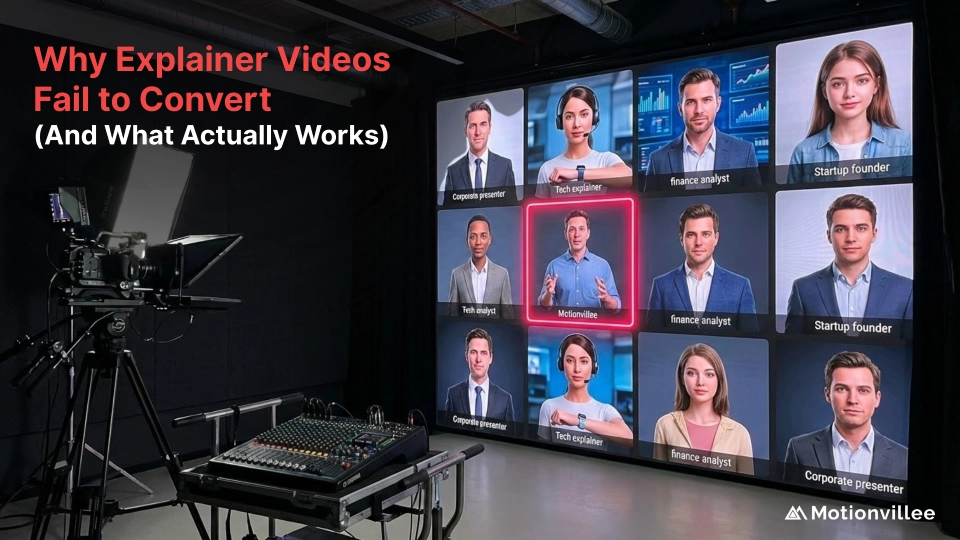
The companies not seeing those results usually aren’t choosing the wrong format. They’re making avoidable mistakes in how they build and distribute their content.
If you want to know how to create video content people actually watch, the principles are consistent across every data point above: clear message, strong hook, right length, and intentional placement.
Ready to build a video strategy backed by these numbers? Book a strategy call with Motionvillee and let’s map out what your content needs to do.