How to Optimize Landing Pages with Explainer Videos for Higher Conversion
Learning how to optimize landing pages with explainer videos increases conversion rates by 35-86% through strategic video placement, message match between traffic sources and video content, form integration optimization, and systematic A/B testing frameworks that transform high-intent traffic into qualified leads efficiently.
The Landing Page Video Conversion Multiplier Effect
Landing page explainer videos create conversion multiplier effects by reducing confusion, building trust, and maintaining engagement simultaneously, with properly optimized video landing pages converting 35-86% better than text-only equivalents across B2B and SaaS industries.
Video landing pages outperform text-only alternatives through multiple mechanisms:
- Faster value proposition comprehension reducing cognitive load
- Visual trust building through production quality signaling
- Attention retention preventing premature abandonment
- Complex solution explanation in compressed timeframes
- Emotional connection creation through storytelling elements
Video landing page performance improvements:
- 35-86% higher conversion rates vs text-only pages
- 60-80% longer average time on page
- 40-50% reduction in bounce rates
- 55-70% of visitors watch video when prominently placed
- 25-45% higher form completion rates after video viewing
Understanding what explainer videos are and how they work helps teams recognize landing page optimization as critical conversion component requiring strategic video implementation beyond generic placement approaches.
Understanding Why Video Transforms Landing Page Performance
Video transforms landing page performance through psychological trust building, attention retention advantages, and information processing efficiency that text cannot match, with visual medium overcoming skepticism and confusion simultaneously while maintaining engagement.
The Psychology of Visual Trust Building on High-Intent Pages
High-intent landing page visitors arrive skeptical from advertising exposure, requiring rapid trust establishment that video achieves through production quality signaling, spokesperson authenticity, and brand consistency cues that text descriptions cannot convey effectively.
Visual trust signals in video:
- Production quality signaling professional organization investment
- Real spokesperson presence creating human connection
- Office or product footage proving legitimate operations
- Brand consistency across visual elements building recognition
- Testimonial integration showing satisfied customer proof
First impressions form within 50 milliseconds of page load, with video thumbnail quality, play button clarity, and professional appearance contributing to immediate trust assessment before playback begins.
Attention Retention Statistics That Prove Video’s Power
Landing page visitors allocate 60-80% of attention to video elements when prominently placed, with average viewing time of 45-75 seconds delivering more message absorption than typical 8-12 second text scanning behavior on text-only pages.
| Content Format | Average Attention Time | Information Retention | Conversion Impact |
|---|---|---|---|
| Text-only landing page | 8-12 seconds | 10-20% | Baseline |
| Text with static images | 15-20 seconds | 20-30% | +10-15% |
| Text with explainer video | 45-75 seconds | 50-70% | +35-60% |
| Video-first layout | 60-90 seconds | 60-80% | +50-86% |
Video viewing time correlates directly with conversion probability, with visitors watching 75%+ of video duration converting 3-5x higher than those abandoning before completion.
Strategic Video Placement for Maximum Conversion Impact
Video placement determines whether visitors engage with content, with above-fold positioning, video-first layouts, and mobile-optimized implementation creating 200-400% view rate differences that directly impact conversion performance.
Above the Fold Positioning: Testing Data and Best Practices
The Above-fold video placement generates 55-70% view rates compared to 15-25% for below-fold positioning, requiring immediate video visibility without scrolling for maximum engagement from traffic sources with high abandonment risk like paid ads.
Above-fold optimization tactics:
- Video occupying 50-70% of above-fold space on desktop
- Prominent play button minimum 80×80 pixels for clarity
- Professional thumbnail showing product or spokesperson
- Clear video title stating content benefit
- Mobile adaptation maintaining above-fold presence
Test above-fold vs below-fold placement systematically using Google Optimize or similar tools, measuring both video view rates and final conversion rates rather than view rates alone.
Video-First vs Text-First Landing Page Layouts
The Video-first layouts treating video as primary content element with minimal supporting text outperform text-first pages by 40-65% for traffic sources like paid ads where visitors expect immediate visual information matching ad creative expectations.
Video-first layout structure:
- Benefit-focused headline (5-10 words maximum)
- Video player occupying 60-70% above-fold space
- 3-5 bullet points reinforcing video key messages
- Prominent CTA button with contrasting color
- Extended information below fold for detail seekers
Text-first layout advantages:
- Better performance for organic traffic expecting text content
- SEO benefits from extensive text indexing
- Accessibility for video-averse visitors
- Lower production dependency enabling faster iteration
Match layout approach to traffic source characteristics rather than applying universal strategy across all campaigns.
Mobile-Responsive Placement That Maintains Conversion Rates
The Mobile devices generate 55-70% of landing page traffic, requiring vertical or square video formats, large touch targets, and optimized file sizes preventing slow loading that increases bounce rates before video viewing opportunity.
Mobile video optimization requirements:
- Square (1:1) or vertical (9:16) formats for mobile screens
- File size under 5MB enabling fast loading on cellular networks
- Play button minimum 60×60 pixels for touch accuracy
- Captions mandatory for public browsing without sound
- Responsive player scaling maintaining aspect ratio
Understanding best website placement for explainer videos helps teams recognize landing page placement as unique context requiring campaign-specific optimization beyond general website guidelines.
Video Content Optimization Specifically for Landing Pages
Landing page videos require different content optimization than website explainers or social media clips, with message match to traffic sources, optimal length formulas, and hook requirements addressing pre-qualified audiences rather than cold discovery.
Message Match Between Traffic Source and Video Content
The Message consistency between traffic source (ad, email, social post) and landing page video increases conversion by 45-75% through expectation fulfillment, with exact headline and benefit language repetition from source to video preventing dissonance causing abandonment.
Message match requirements:
- Video hook mirrors traffic source headline within first 5 seconds
- Visual branding consistent between ad creative and video
- Offer specifics match exactly across touchpoints
- Tone and spokesperson style maintains consistency
- Problem framing uses identical language from source
Create campaign-specific video versions rather than generic explainers when budget allows, with message match importance increasing proportionally to traffic cost and audience cold temperature.
The Optimal Landing Page Video Length Formula
Optimal landing page video length balances message completeness against attention span realities, with 45-90 second videos performing best for B2B lead generation while 30-45 second videos win for e-commerce or low-consideration purchases.
| Video Length | Best Use Case | Completion Rate | Conversion Impact |
|---|---|---|---|
| 30-45 seconds | E-commerce, simple offers | 70-85% | +25-40% |
| 45-60 seconds | SaaS trials, webinars | 60-75% | +35-55% |
| 60-90 seconds | B2B demos, consultations | 50-65% | +45-70% |
| 90+ seconds | High-ticket, complex | 40-55% | +50-86% |
Length optimization depends on offer complexity and average contract value, with higher-value conversions justifying longer videos that thoroughly educate and pre-qualify prospects.
Hook Requirements for Pre-Qualified Landing Page Traffic
Landing page video hooks differ from cold traffic hooks because visitors arrive pre-qualified through traffic source filtering, requiring immediate value delivery and benefit confirmation rather than problem awareness creation.
Landing page hook formulas:
- Benefit confirmation: “Yes, [product] helps you [achieve outcome] in [timeframe]”
- Problem acknowledgment: “If you’re struggling with [pain point], here’s how we solve it”
- Differentiation statement: “Unlike [alternatives], we [unique approach] to deliver [result]”
- Social proof lead: “[X] companies use [product] to [achieve specific outcome]”
Skip lengthy problem agitation because traffic source already created awareness, moving immediately to solution explanation and differentiation.
Technical Implementation That Protects Conversion Rates
Technical implementation affects both video engagement and overall page performance, with autoplay decisions, page speed optimization, and player selection determining whether video improves conversions or creates friction reducing performance below baseline.
Autoplay vs Click-to-Play: When Each Approach Wins
The Autoplay videos increase view rates by 200-350% but risk negative user experience when poorly implemented, with muted autoplay winning for paid traffic while click-to-play performs better for organic traffic expecting user control.
Autoplay best practices:
- Mute by default with prominent unmute button overlay
- Captions enabling comprehension without sound
- Clear pause control visible immediately
- Disable loop preventing annoying repetition
- Mobile autoplay requiring user scroll interaction
Click-to-play advantages:
- User control reducing annoyance risk
- Better performance for organic traffic
- Lower bounce rate from unexpected video
- Accessibility compliance improvements
Test autoplay vs click-to-play measuring both video view rates and page bounce rates, with high bounce rate increases indicating autoplay frustration outweighing engagement benefits.
Page Load Speed Optimization With Video Elements
Page load speed affects conversion rates directly, with 1-second delays reducing conversions by 7%, requiring video implementation through third-party hosting preventing video file size from slowing page performance.
Speed optimization tactics:
- Third-party hosting (Wistia, Vimeo, YouTube) preventing file impact
- Lazy loading for below-fold videos
- Poster image optimization reducing initial load
- Preconnect hints for video hosting domains
- CDN distribution for faster global delivery
Monitor Core Web Vitals ensuring video implementation doesn’t degrade Largest Contentful Paint (LCP) or Cumulative Layout Shift (CLS) metrics affecting SEO and user experience.
Video Player Selection for Minimal Friction
Video player selection impacts conversion through friction reduction, with professional players from Wistia or Vimeo offering customization, analytics, and lead capture capabilities that generic YouTube embeds lack.
Player platform comparison:
- Wistia: Best lead generation tools and analytics, $24-$300/month, brandable player
- Vimeo: Professional appearance and privacy controls, $7-$75/month, customizable
- YouTube: Free hosting with excellent delivery, limited customization, external branding
- HTML5 self-hosted: Complete control, requires CDN and technical management
Understanding how to effectively promote and distribute explainer videos helps teams recognize landing pages as critical distribution touchpoints requiring technical optimization beyond creative quality alone.
Form Integration Strategies With Video Elements
Form and video integration through strategic placement, progressive disclosure timing, and multi-step form design determines whether video education converts into form submissions efficiently or creates confusion reducing conversion below baseline performance.
Video Above Form vs Video Below Form Testing Results
Video-above-form placement outperforms video-below-form by 35-55% because sequential progression from education to action feels natural, with visitors completing video education before encountering conversion ask creating psychological commitment progression.
| Video Placement | Avg Conversion Rate | Video View Rate | Form Completion |
|---|---|---|---|
| Video above form | 12-18% | 55-70% | 65-80% |
| Video beside form | 10-15% | 45-60% | 60-75% |
| Video below form | 7-11% | 25-40% | 55-70% |
| No video | 6-10% | N/A | 50-65% |
Video proximity to form matters, with 200-400 pixel spacing creating visual connection without cluttered appearance that reduces professional perception.
Progressive Disclosure: When to Show Video Before or After Form
The Progressive disclosure showing video after initial form submission works for multi-step processes, with curiosity-driven initial conversion followed by video education before final commitment reducing friction for high-commitment offers.
Progressive disclosure approaches:
- Step 1: Brief form (email, name) with benefit promise
- Step 2: Video playing automatically after Step 1 submission
- Step 3: Extended form (company, role) after video completion
- Step 4: Scheduling or payment interface
This approach works best for free trials, demo scheduling, or consultation bookings where multiple commitment stages naturally exist.
Multi-Step Forms With Strategic Video Placement
The Multi-step forms increase completion rates by 15-35% through reduced intimidation, with video placement between steps maintaining engagement during progression while reinforcing value justifying continued form completion effort.
Multi-step video integration:
- Video before Step 1: Full explainer building initial interest
- Video between steps: Short testimonial reinforcing value
- Video after completion: Thank you video with next steps
Understanding how to promote explainer videos through LinkedIn and ways to repurpose explainer videos for social platforms helps teams drive quality traffic to optimized landing pages.
Social Proof and Trust Elements Around Video Content
Social proof and trust elements surrounding video increase conversion by 25-45% through credibility reinforcement, with testimonials, logos, and security badges positioned near video creating cumulative trust effect exceeding individual element impact.
Testimonial Integration That Reinforces Video Message
Written testimonials positioned immediately below video reinforce video messages through third-party validation, with specific outcome statements matching video benefit claims increasing credibility more than generic praise.
Effective testimonial placement:
- 3-5 testimonials directly below video player
- Specific outcomes and metrics rather than vague praise
- Customer name, company, and photo for authenticity
- Industry or use case diversity showing broad applicability
- Quote highlighting same benefits video emphasizes
Logo Placement and Credibility Signals Near Video
Client logo displays positioned near video increase conversion by 15-30% through authority transfer, with recognizable brand logos signaling safety and quality through association rather than direct proof.
Logo placement optimization:
- 8-12 recognizable logos maximum preventing overwhelm
- Grayscale or muted colors maintaining visual hierarchy
- Placement immediately above or below video
- Headline like “Trusted by leading companies” providing context
Security Badges and Trust Markers in Video Proximity
Security badges (SSL certificates, payment processor logos, compliance certifications) positioned near forms reduce abandonment by 20-40% through risk mitigation, with proximity to video creating comprehensive trust environment.
Understanding how explainer videos boost email open rates helps teams recognize video’s cross-channel trust-building impact beyond landing page conversion alone.
Call-to-Action Optimization in Video-Centric Landing Pages
CTA optimization in video landing pages requires coordination between in-video CTAs and on-page buttons, with dual CTA strategies, placement testing, and copy optimization determining whether video engagement converts to form submissions efficiently.
Video End Screen CTAs vs Separate Page CTAs
The Video end screen CTAs directing to forms increase conversion by 15-25% when combined with persistent page CTAs, with redundant calls-to-action catching viewers at multiple decision moments throughout experience.
Dual CTA strategy:
- In-video CTA at 80-90% video completion
- Page CTA button immediately below video player
- Sticky footer CTA appearing after video viewing
- Exit intent CTA for abandoning visitors
Dual CTA Strategy for Different Commitment Levels
The Dual CTAs offering high-commitment (demo request) and low-commitment (resource download) options increase total conversions by 20-40% through alternative paths matching visitor readiness levels.
Commitment level options:
- Primary CTA: High-commitment conversion (demo, consultation)
- Secondary CTA: Low-commitment action (guide download, newsletter)
- Visual hierarchy emphasizing primary without hiding secondary
- Different colors distinguishing options clearly
Button Placement, Copy, and Color Testing With Video
CTA button optimization through placement proximity to video, action-oriented copy, and high-contrast colors increases click rates by 25-50%, with testing revealing audience-specific preferences that generic best practices miss.
CTA optimization variables:
- Placement: Immediately below video vs beside video vs sticky
- Copy: Benefit-focused vs action-focused vs time-sensitive
- Color: Brand colors vs high-contrast vs psychological associations
- Size: Large prominent buttons vs moderate sizing
A/B Testing Framework for Video Landing Page Optimization
Systematic A/B testing reveals optimal video landing page configurations for specific traffic sources and audiences, with structured testing methodology preventing premature conclusions while enabling continuous conversion rate improvements.
Testing Video Presence vs Video Absence Baseline
Initial testing should compare video presence vs absence establishing baseline lift, with minimum 1,000 visitors per variation and 95% statistical confidence before declaring video implementation successful.
Baseline test structure:
- Control: Text-only landing page with current performance
- Variation: Identical page with video added above fold
- Measure: Conversion rate, bounce rate, time on page
- Duration: Run until statistical significance achieved
Creative Variation Testing Within Video Elements
After establishing video lift, test creative variations including video length, hook approaches, CTA timing, and spokesperson selection optimizing performance beyond generic video presence alone.
Creative test priorities:
- Video length: 45 vs 60 vs 90 seconds
- Hook approach: Problem-focused vs benefit-focused vs social proof
- CTA timing: Early (50%) vs late (90%) placement
- Spokesperson: Founder vs professional vs animation only
Placement and Layout Experiments for Incremental Gains
Placement testing including above-fold vs below-fold, video-first vs text-first layouts, and form proximity optimization generates incremental 5-15% gains compounding for substantial cumulative improvement.
Understanding how to promote animated explainer videos and tips for distributing explainer videos helps teams build comprehensive strategies beyond landing page optimization alone.
Platform and Campaign-Specific Landing Page Strategies
Landing page optimization varies by traffic source, with PPC ads, social media campaigns, and email traffic requiring different video approaches matching audience temperature and expectation context.
PPC Landing Pages With Explainer Videos
The PPC landing pages require tight message match between ad creative and video content, with 45-60 second videos performing best for cold paid traffic requiring education before conversion readiness.
PPC landing page requirements:
- Video hook mirroring ad headline within first 3 seconds
- Visual consistency between ad and video thumbnail
- Clear benefit delivery matching ad promise
- Strong CTA addressing search intent explicitly
Understanding how to use explainer videos in paid ads helps teams create cohesive ad-to-landing-page experiences maximizing campaign ROI.
Social Media Ad Landing Page Video Requirements
The Social media traffic expects entertaining, native-style content requiring different video approaches than professional PPC videos, with authentic, unpolished aesthetics outperforming corporate production for social-sourced visitors.
Social landing page video characteristics:
- 30-45 second shorter length matching social attention spans
- Native, authentic style consistent with social platform norms
- Captions essential as social users expect sound-off viewing
- Visual continuity from social ad to landing page video
Email Campaign Landing Pages That Convert With Video
Email landing pages receive warmer traffic than paid sources, allowing longer 60-90 second videos providing comprehensive information to engaged subscribers already familiar with brand and offer context.
Understanding YouTube distribution strategy helps teams leverage video across multiple channels beyond landing page optimization alone.
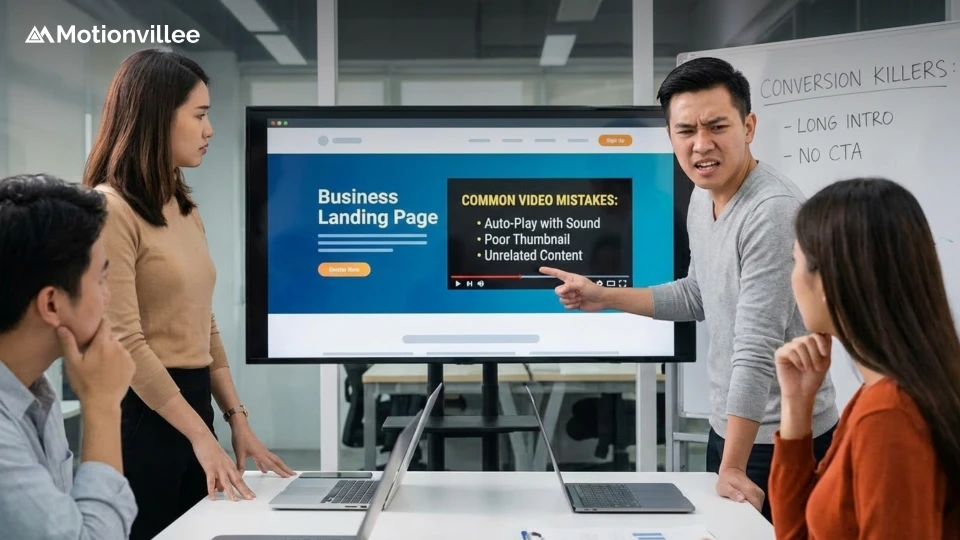
Common Landing Page Video Mistakes That Kill Conversions
Predictable landing page video mistakes including content-copy contradictions, technical friction, and over-complicated goals reduce conversion by 30-70% below potential, with systematic error avoidance protecting video investment returns.
Video Content That Contradicts or Confuses Page Copy
Message mismatch between video content and surrounding copy creates confusion reducing conversion by 40-60%, with inconsistent benefit claims, contradictory information, or misaligned offers destroying trust that video otherwise builds.
Consistency requirements:
- Video hook matches page headline exactly
- Benefit claims identical across video and text
- Offer details consistent (pricing, terms, deliverables)
- Tone alignment between video and written copy
- Visual branding consistent throughout page
Technical Issues That Create Abandonment
The Technical problems including slow loading, player errors, or mobile incompatibility increase bounce rates by 50-150%, with video implementation creating abandonment rather than conversion when technical execution fails.
Technical issue prevention:
- Test video playback across devices and browsers
- Monitor page load speed with video elements
- Implement fallback poster images for player failures
- Use reliable hosting preventing buffering issues
- Ensure mobile touch controls work properly
Over-Complicating Simple Conversion Goals
Multiple competing CTAs, excessive form fields, or unclear next steps dilute conversion focus, with single clear conversion path outperforming complex multi-option layouts by 30-60% for straightforward lead generation campaigns.
Building High-Converting Video Landing Pages Systematically
Learning how to optimize landing pages with explainer videos requires strategic placement, message match, technical implementation, and systematic testing transforming high-intent traffic into qualified leads through data-driven optimization rather than generic best practice application.
Critical optimization components:
- Above-fold video placement capturing maximum visitor attention
- Message match between traffic sources and video content
- Technical implementation protecting page speed and user experience
- Form integration creating natural education-to-action progression
- A/B testing framework enabling continuous incremental improvement
Video-first layouts outperform text-first approaches by 40-65% for paid traffic expecting immediate visual information, while organic traffic prefers text-first designs with supporting video elements.
Optimal video length varies by offer complexity and traffic source, with 45-90 second videos performing best for B2B lead generation while shorter 30-45 second videos win for simple offers and e-commerce conversions.
Social proof elements including testimonials, client logos, and security badges positioned near video create cumulative trust effects increasing conversion by 25-45% through comprehensive credibility establishment.
Platform-specific optimization matching video style and length to traffic source expectations prevents disconnect between ad experience and landing page reality that destroys conversion potential.
Working with experienced video production services and professional explainer video production teams ensures videos meet both creative quality and technical landing page implementation requirements.
Schedule a strategy call with Motionvillee to develop video landing page strategies optimizing placement, content, technical implementation, and testing frameworks for maximum conversion rate improvement supporting predictable lead generation and revenue growth.