Why B2B Buyers Ghost After Your Website Visit (And How Visual Clarity Stops It)
B2B website visitor abandonment is the silent killer in your marketing funnel. You pay for ads. Traffic arrives. Analytics show 3-minute session times. Then nothing. No demo requests, No contact forms, and no follow-up. Just ghosted visitors who seemed engaged but vanished.
Your website is bleeding qualified prospects before they take action. 70% of B2B visitors leave without converting, and most never return. This isn’t bounce rate or quick exits. These are engaged visitors who read content, view pages, and disappear.
The problem isn’t your traffic quality or budget. It’s clarity failure. Visitors can’t understand your value quickly enough to justify the next step.
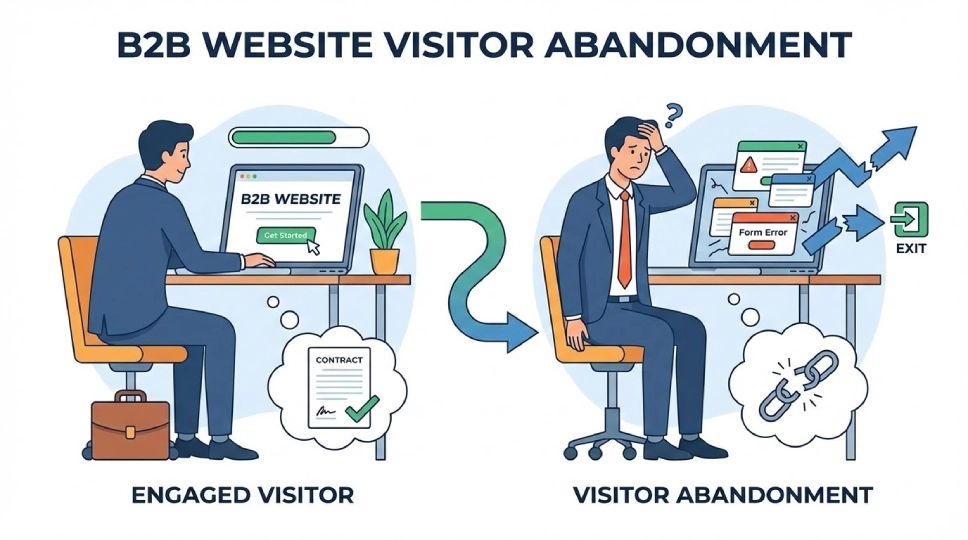
What Is B2B Website Visitor Abandonment?
B2B website visitor abandonment occurs when qualified prospects engage with your website content but leave without taking conversion actions, despite spending enough time to indicate genuine interest and fit.
This differs from bounce rate. Bounced visitors leave immediately from landing pages. Abandoned visitors engage meaningfully but don’t convert.
They view your homepage, read your product page, check your pricing, maybe visit your about page. Session analytics show 2-5 minutes of activity. Then they exit without requesting demos, downloading resources, or contacting sales.
The engagement suggests interest. The exit suggests confusion or uncertainty preventing action.
Why Is B2B Website Visitor Abandonment Different From B2C?
B2B website visitor abandonment is different because purchase decisions require internal justification, involve multiple stakeholders, and need comprehensive understanding that single website visits rarely provide.
The Multi-Stakeholder Dynamic
B2C visitors buy for themselves. B2B visitors must convince others. A single confused visitor means an entire buying committee lacks clarity.
If they can’t explain your value after their website visit, they can’t advocate internally. So they abandon rather than schedule demos they can’t justify.
The Internal Justification Requirement
B2C purchases need personal confidence. B2B purchases need board approval, budget allocation, and ROI justification. Website visits must provide ammunition for internal business cases.
Without this, visitors abandon to avoid starting conversations they can’t support.
The Comprehension Threshold
B2C products sell on emotion and simple benefits. B2B products require understanding complex value propositions, integration implications, and organizational fit. Understanding how to make your SaaS product easy to understand addresses this challenge.
What Do Visitors Actually Do Before Ghosting?
Before ghosting, visitors typically view 3-5 pages including homepage, product/service page, and pricing, spend 2-5 minutes reading, then exit without conversion actions despite apparent engagement.
The Common Visitor Journey
1 Page: Homepage (60-90 seconds reading hero section and scanning content)
2 Page: Product or Services page (90-120 seconds reading feature descriptions)
3 Page: Pricing page (30-60 seconds checking investment levels)
4 Page: About or Case Studies page (optional, 60 seconds)
Then exit. Total session: 3-5 minutes. Zero conversion actions.
The False Engagement Signal
These session metrics look healthy. Time on site suggests interest. Multiple page views indicate exploration. But conversion rate remains 0%.
Engagement without conversion is the signature of clarity failure.
What Questions Remain Unanswered That Cause Abandonment?
Unanswered questions causing abandonment include “What exactly does this do?”, “Is this for companies like mine?”, “How is this different from alternatives?”, and “What happens if I request a demo?”
Question 1: Core Function Clarity
“What does this actually do?” Your homepage says you “empower teams” or “transform workflows.” These phrases sound nice but mean nothing concrete.
Visitors need simple functional understanding. Without it, they can’t evaluate fit.
Question 2: Audience Fit Validation
“Is this for me?” Your site might serve multiple audiences. Visitors can’t determine if they’re the right fit. Enterprise features for SMB budgets. Technical depth for non-technical buyers.
Ambiguous targeting creates abandonment from uncertainty.
Question 3: Differentiation Understanding
“How is this different?” You list features competitors also claim. Visitors see no clear distinction. Without differentiation clarity, they default to “need to research more” which means abandon now.
Generic positioning creates abandonment through sameness. This is why explainer videos that simplify complex products reduce abandonment significantly.
Question 4: Next Step Anxiety
“What happens if I click that button?” Demo requests feel risky. Will sales hound them? Do they need executive approval first? Is this a 30-minute sales pitch?
Unclear next steps create friction that triggers abandonment.
How Do You Know If Clarity Failure Causes Your Abandonment?
Clarity failure causes abandonment when analytics show high engagement but low conversion, exit surveys cite “need to understand better,” heatmaps reveal confused navigation patterns, and A/B tests show messaging changes dramatically impact conversion.
The Analytics Pattern
Review Google Analytics for sessions with 2+ minutes and 3+ page views but zero conversions. High numbers indicate B2B website visitor abandonment from clarity problems, not traffic quality issues.
Engaged traffic that doesn’t convert needs better clarity, not more traffic.
The Exit Survey Signal
If you run exit surveys, responses like “I need to understand this better” or “Still researching options” or “Not sure if this fits” all indicate clarity gaps.
Visitors are telling you they’re confused.
The Heatmap Confusion Evidence
Hotjar or similar tools showing visitors scrolling up and down repeatedly, clicking between sections multiple times, or hovering over content without clicking suggests they’re hunting for clarity.
Confused navigation reveals unclear value propositions.
What Percentage of B2B Website Traffic Typically Abandons?
Typical B2B websites see 60-75% abandonment rates for engaged visitors, with only 25-40% taking any conversion action, and just 2-5% requesting demos or contacting sales directly.
Let’s calculate the real cost:
- 1,000 monthly website visitors
- 700 abandon without converting (70% abandonment)
- 300 take some action (downloads, contact forms)
- 30 request actual demos (3% conversion)
If 30% of those 700 abandoned visitors were qualified (210 prospects), and your demo-to-close rate is 25%, you’re losing approximately 52 potential deals monthly to B2B website visitor abandonment.
At $25K average deal size, that’s $1.3M in annual lost revenue from clarity failure.
Why Do Visitors Leave Instead of Requesting Demos?
Visitors leave instead of requesting demos because they lack confidence in fit, can’t articulate value internally, fear wasting time on irrelevant solutions, or don’t understand enough to justify sales conversations.
The Confidence Gap
Visitors need 70-80% certainty before requesting demos. Text descriptions might give them 40-50%. The gap between current and required confidence triggers abandonment.
They think “I need to research more” when they mean “I don’t understand enough yet.”
The Internal Justification Barrier
Requesting demos creates internal accountability. They’ll need to explain why they’re exploring your solution. If they can’t articulate clear value from your website, they won’t start that conversation.
Abandonment protects them from internal questions they can’t answer. Understanding what explainer videos are and how they work provides the clarity that enables demo requests.
The Time Waste Avoidance
Demo calls take 30-60 minutes. If visitors aren’t confident in fit, they won’t invest that time. Unclear websites make fit assessment impossible, so visitors abandon to avoid potentially wasted hours.
How Does Visual Content Reduce B2B Website Visitor Abandonment?
Visual content reduces abandonment by providing immediate comprehension in 90 seconds instead of 5 minutes of reading, demonstrating concepts that resist text explanation, and building confidence through seeing rather than imagining functionality.
The Compression Advantage
Text explanation of your platform: 800 words, 4 minutes to read. Video demonstration: 90 seconds to watch. Same information, 60% time savings.
Faster comprehension means less abandonment from fatigue.
The Show vs Tell Impact
Text: “Our platform integrates with your existing tools.” Question: Which tools? How does integration work? What does that look like?
Video: Shows actual integration screens in 15 seconds. Questions answered visually before they form.
The Confidence Building Effect
Reading creates understanding. Seeing creates belief. Video lets visitors visualize your solution in their context, building confidence that reading alone can’t achieve.
This confidence converts abandonment into demo requests. This is why SaaS video types outperform landing pages for conversion.
Where Should Video Content Live to Stop Abandonment?
Video content should live on homepage hero sections, product pages above the fold, pricing pages explaining value tiers, and as exit intent popups offering last-chance clarity before visitors abandon.
Homepage Hero Placement
This is where abandonment starts. 60% of visitors never scroll below the fold. Video here provides immediate clarity before they exit.
Hero video should answer: What is this? Who is it for? Why does it matter?
Product Page Integration
Product pages are high-intent destinations. Visitors here are evaluating solutions. Video demonstrations showing functionality reduce the “I still don’t get it” abandonment.
Product videos should show, not describe.
Pricing Page Context
Visitors checking pricing have serious interest but often abandon from complexity. Short videos explaining tier differences and value at each level reduce confusion abandonment.
Exit Intent Intervention
When visitors trigger exit intent, popup offering 60-second explainer gives last chance clarity. “Before you go, watch this quick overview.” Many abandoning visitors convert when given compressed clarity. Learning best website placement strategies maximizes impact.
What Type of Video Content Stops Each Abandonment Pattern?
Different abandonment patterns require different video types: homepage abandoners need 60-second explainers, product page abandoners need feature demos, pricing abandoners need value tier comparisons, and return visitors need deeper technical content.
For Homepage Abandoners
Problem: They don’t understand what you do.
Solution: 60-90 second core explainer answering “What is this?” “Who is it for?” “Why does it matter?”
Goal: Get them to product pages with basic comprehension.
For Product Page Abandoners
Problem: They understand concept but can’t visualize functionality.
Solution: 2-3 minute product demo showing actual interface and workflows.
Goal: Build confidence through visualization. Understanding how to explain complex products in 90 seconds helps create these videos.
For Pricing Page Abandoners
Problem: They don’t understand tier differences or value justification.
Solution: 90-second tier comparison video showing who each tier serves and what extra value higher tiers provide.
Goal: Make pricing decision obvious instead of confusing.
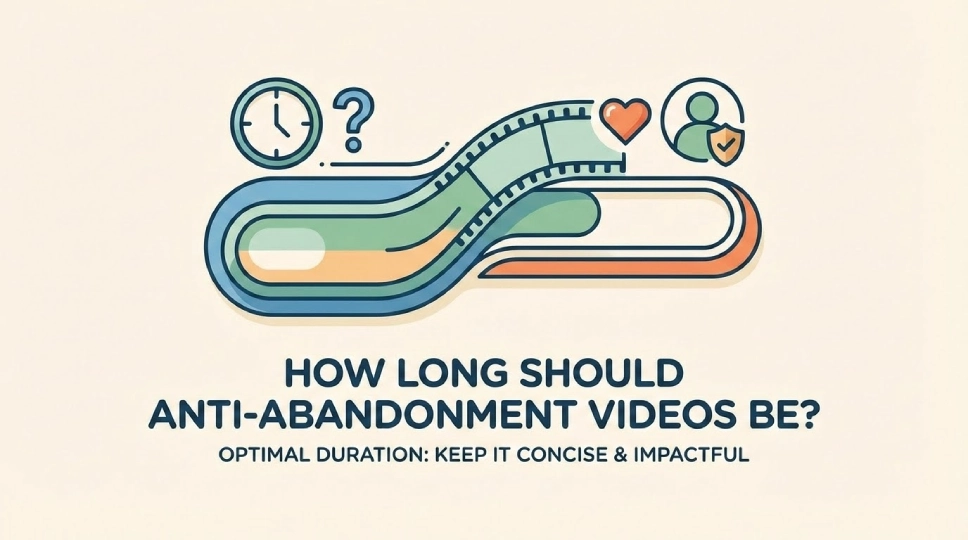
How Long Should Anti-Abandonment Videos Be?
Anti-abandonment videos should be 60-90 seconds for homepage explainers, 2-3 minutes for product demonstrations, 90 seconds for pricing explanations, and 30-45 seconds for exit intent interventions.
Length correlates with visitor intent and page purpose:
Homepage = 60-90 Seconds
Visitors here know least about you. Short videos respect their time while providing foundational understanding. Longer videos increase abandonment from video itself.
Product Pages = 2-3 Minutes
Higher intent visitors tolerate longer content. They’re evaluating seriously and need comprehensive understanding. But beyond 3 minutes, even high-intent visitors abandon.
Exit Intent = 30-45 Seconds
Visitors are leaving. You have seconds to provide value. Ultra-short videos showing core value quickly are the only option.
What Metrics Indicate Video Is Reducing Abandonment?
Metrics indicating video reduces abandonment include increased time on page without increased exit rates, higher scroll depth after video placement, improved conversion rates on video-enabled pages, and reduced bounce rates from video landing pages.
The Time + Conversion Correlation
Before video: 3 minutes average session, 2% conversion. After video: 2.5 minutes average session, 5% conversion.
Less time but more conversions means video creates faster clarity.
The Scroll Depth Signal
If scroll depth increases after video placement, visitors are engaging more with page content after understanding from video. This indicates video provides context that makes further reading valuable.
The Page-Level Conversion Change
Compare conversion rates for pages with vs without video. Typical improvements range from 2% to 5-7% conversion when video adds clarity.
The delta shows video’s direct abandonment reduction impact. This relates to optimizing landing pages with video.
How Do You Create Video Content That Actually Stops Abandonment?
Create abandonment-reducing video by starting with visitor confusion points, demonstrating rather than describing, keeping technical jargon minimal, showing real product interfaces, and ending with clear next steps.
Step 1: Identify Confusion Points
Interview sales about common prospect questions. Review exit survey data. Analyze support tickets. These reveal what visitors don’t understand from your website.
Video should address top 3 confusion points directly.
Step 2: Show, Don’t Tell
Bad script: “Our platform helps you manage workflows efficiently.”
Good script: Shows screen recording of workflow being created in 30 seconds.
Demonstration creates comprehension. Description creates questions.
Step 3: Minimize Jargon
Every technical term is friction. “API integration” stops non-technical buyers. “Connects with your existing tools” keeps everyone.
Simplify language to 8th-grade reading level.
Step 4: Use Real Interface
Abstract animations help but actual product screens build more confidence. Visitors want to see what they’re buying.
Real interface = real credibility. Understanding elements of high-converting B2B videos ensures quality.
What Happens If You Only Fix Text Without Adding Video?
Fixing text without video provides 20-30% abandonment improvement, but video delivers 50-70% improvement because visual demonstration creates comprehension that optimized text alone cannot achieve.
The Text Optimization Ceiling
Better copywriting helps. Clearer headlines improve clarity. Simpler language reduces confusion. But text optimization hits diminishing returns.
You can improve text from bad to good, but good text still requires reading, processing, and imagining.
The Video Multiplier Effect
Video doesn’t replace text. It multiplies text effectiveness. Visitors watch 90-second video gaining 70% comprehension, then read text with context, achieving 95% understanding.
Video + text outperforms either alone.
How Quickly Can Video Reduce Your Abandonment Rate?
Video reduces abandonment rates within 14-30 days of implementation, with initial metrics showing improvement in first week and full impact visible after one full month of visitor data.
Week 1: Immediate Signals
Video completion rates and click-through rates from video to conversion actions show immediate engagement improvements. These signal video is working before abandonment metrics fully reflect change.
Week 2-4: Abandonment Data
Sufficient visitor volume accumulates to show statistically significant abandonment rate changes. Expect 30-50% reduction in B2B website visitor abandonment for video-enabled pages.
Month 2+: Optimization Phase
With baseline established, optimize video placement, length, and messaging based on real performance data. Ongoing improvements compound initial gains. This is why every SaaS product needs explainer videos.
What Investment Does Abandonment-Reducing Video Require?
Abandonment-reducing video requires $8,000-$15,000 for professional production of 3-4 strategic videos covering homepage, product, and pricing pages, with 4-6 week production timeline.
The Strategic Video Package
- 1 homepage explainer (90 seconds): $4,000-$6,000
- 1 product demo (2-3 minutes): $5,000-$8,000
- 1 pricing explainer (90 seconds): $3,000-$5,000
Total: $12,000-$19,000 for complete abandonment prevention system.
The ROI Calculation
If video reduces abandonment from 70% to 40% (30 percentage point improvement), and you have 1,000 monthly visitors with 20% qualified rate:
300 qualified visitors × 30% reduced abandonment = 90 additional conversions monthly.
At 25% demo-to-close rate and $25K average deal size: 22.5 additional deals = $562K additional annual revenue.
$15,000 investment pays back in 10 days. Working with explainer video production services ensures professional quality.
How Do You Know Which Pages Need Video Most Urgently?
Pages needing video most urgently show high traffic with high exit rates, long time on page without conversion, and represent critical funnel stages where prospects make continuation decisions.
The Traffic + Exit Analysis
Check Google Analytics for pages with 500+ monthly visitors and 60%+ exit rates. High traffic means high opportunity. High exits mean clarity problems.
These pages leak the most prospects.
The Time Without Conversion Signal
Pages where visitors spend 2+ minutes but don’t convert are reading carefully but leaving confused. Video here provides clarity text isn’t delivering.
The Funnel Bottleneck Identification
Use funnel visualization to find where visitors drop off. If 60% reach pricing but only 10% proceed to demo requests, pricing page needs video explaining value. Working with SaaS video production services helps prioritize correctly.
What Mistakes Make Video Increase Rather Than Decrease Abandonment?
Video increases abandonment when it’s too long, autoplays with sound, loads slowly, doesn’t address actual confusion points, or uses jargon that creates more questions than answers.
The Length Mistake
5-minute explainer videos on homepages increase abandonment. Visitors won’t invest that time without knowing if you’re relevant first.
Longer isn’t clearer. Concise is clearer.
The Autoplay Error
Video autoplaying with sound is intrusive. Visitors immediately close the tab. This creates higher abandonment than no video.
Let visitors choose to play.
The Loading Speed Problem
Video that delays page load by 3+ seconds increases bounce rate before visitors even see content. Optimize hosting and compression.
Slow video is worse than no video.
The Jargon Acceleration
Video using technical terminology without explanation confuses faster than text. Visitors can’t reread video like text, so confusion compounds.
Video jargon is 3x worse than text jargon. Understanding how to increase conversion with video avoids these mistakes.
How Do Return Visitors vs First-Time Visitors Respond to Video?
First-time visitors need foundational explainer videos, while return visitors benefit from deeper product demonstrations and technical content showing advanced capabilities after basic understanding exists.
First-Time Visitor Needs
They know nothing about you. Video must establish: What is this? Who is it for? Why does it matter?
Basic explainers prevent first-visit abandonment.
Return Visitor Needs
They understand basics from first visit. Now they need confidence in functionality, implementation, and fit for their specific situation.
Advanced demos convert return visitor abandonment to demo requests.
The Progressive Content Strategy
Use cookies to show different videos to return visitors. First visit: core explainer. Second visit: product demo. Third visit: customer testimonial.
Progressive depth matches progressive buyer journey. Working with USA video production teams ensures both video types are professionally executed.
What Results Should You Expect From Fixing Website Abandonment?
Fixing website abandonment typically delivers 30-50% reduction in exit rates, 40-80% increase in demo requests, 25-40% shorter sales cycles from better-qualified demos, and 2-3x ROI within first quarter.
Real B2B companies see measurable impact:
Before video: 1,000 monthly visitors, 70% abandonment, 30 demo requests (3% conversion)
After video: 1,000 monthly visitors, 45% abandonment, 55 demo requests (5.5% conversion)
That’s 83% increase in demo volume from the same traffic investment.
If demo-to-close rate is 25% and average deal is $25K: Additional 25 demos monthly × 25% close rate = 6.25 extra deals monthly = $156K additional monthly revenue = $1.87M additional annual revenue.
The investment in video clarity delivers exponential returns by converting traffic you already paid for.
Your qualified traffic is abandoning silently. They’re not rejecting your solution. They’re confused by unclear communication. Within 30 days, you can identify your highest-abandonment pages, create strategic video content, and measure conversion improvements.
Your demo request rate increases because prospects understand value before requesting calls, sales cycles shorten because demos start with educated buyers, and your marketing ROI improves by converting traffic you already paid to acquire.
Stop losing 70% of qualified website visitors to clarity failure. Video communication transforms confusion into comprehension and abandonment into action.